building

How do you sell low carbon?

CLIENT

Self-initiated

PURPOSE

To put visuals of real-time emissions into users hands.

DESCRIPTION

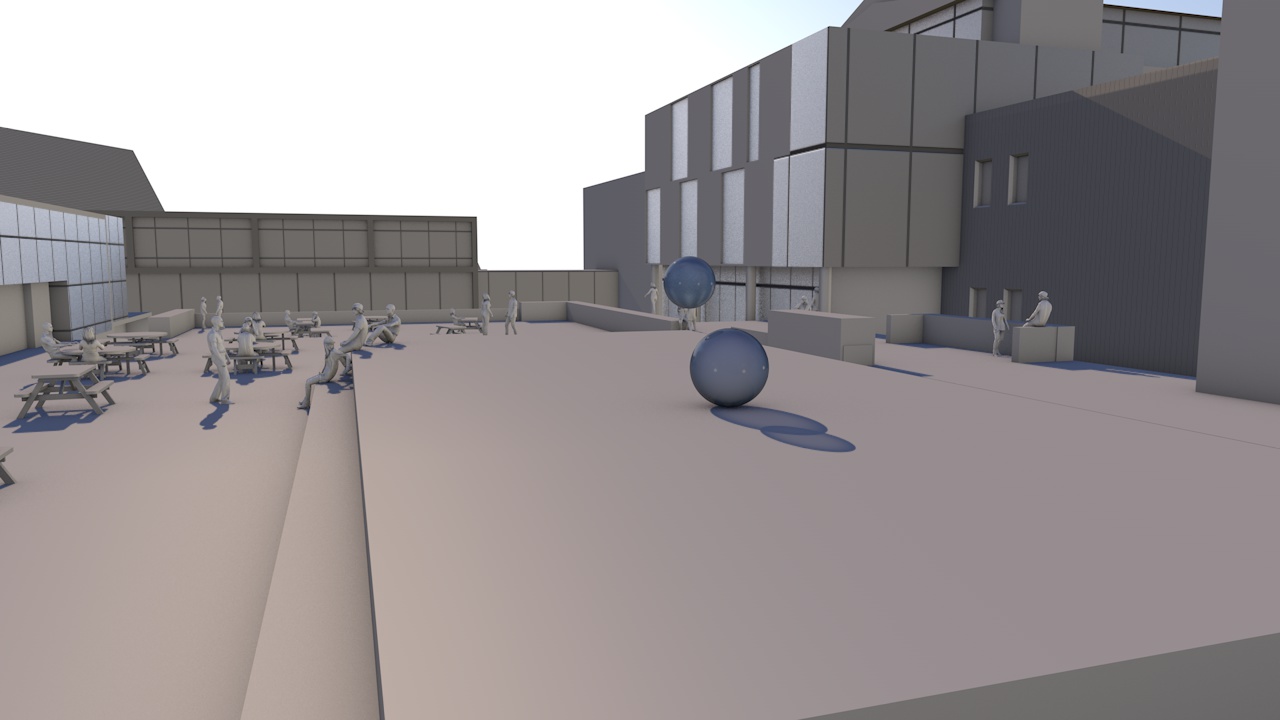
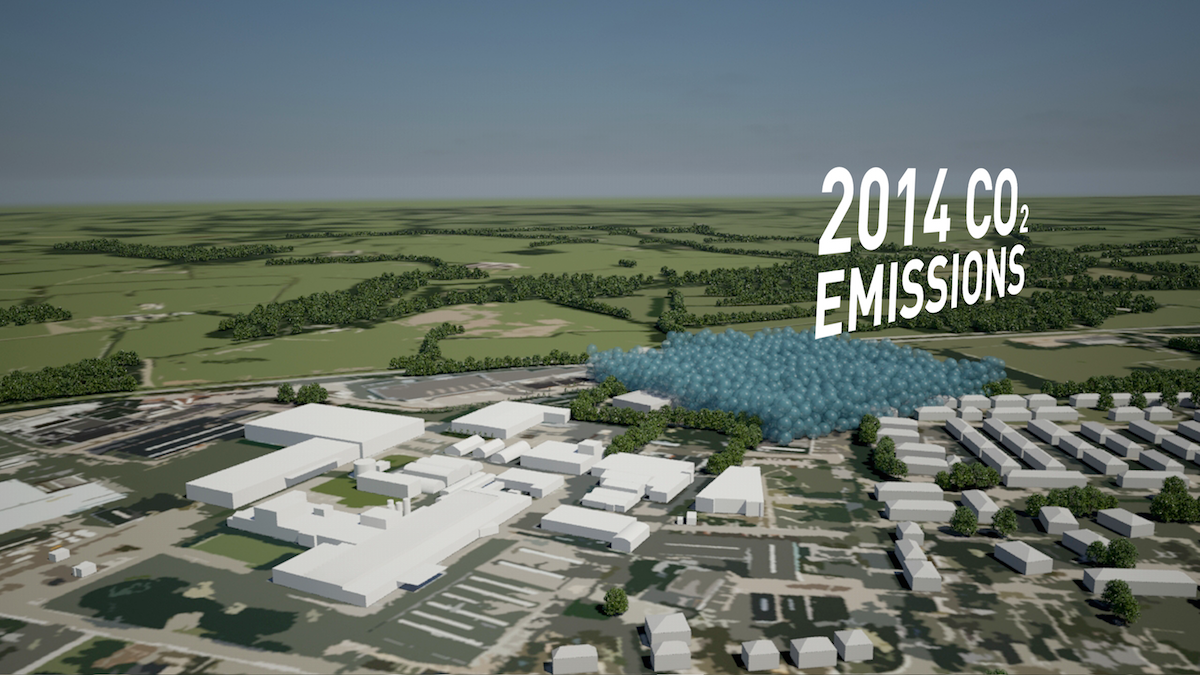
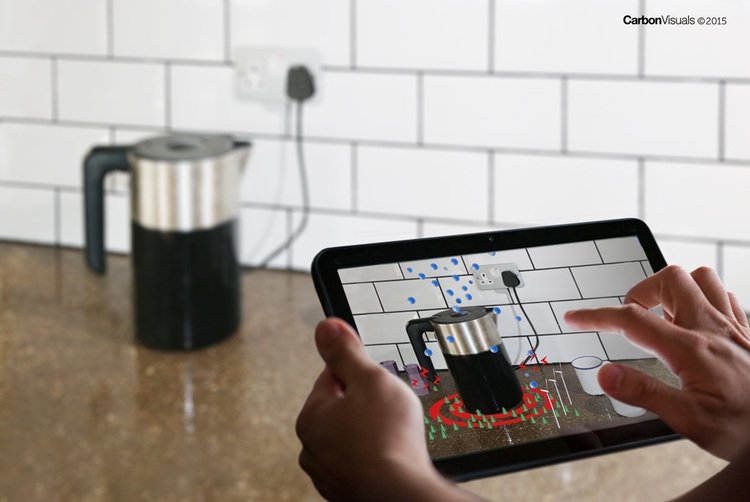
Development of an augmented reality app that reveals actual volumes of CO2 through a smart-phone or tablet screen.

How do you sell low or zero carbon products and services? As more and more companies are putting serious effort into developing products and services for the low-carbon future they face a communications challenge with consumers or B2B customers. How do you get across the benefits of low-carbon in a way that works?

Now there is a solution... an augmented reality app that reveals actual volumes of CO2 through a smart-phone or tablet screen.

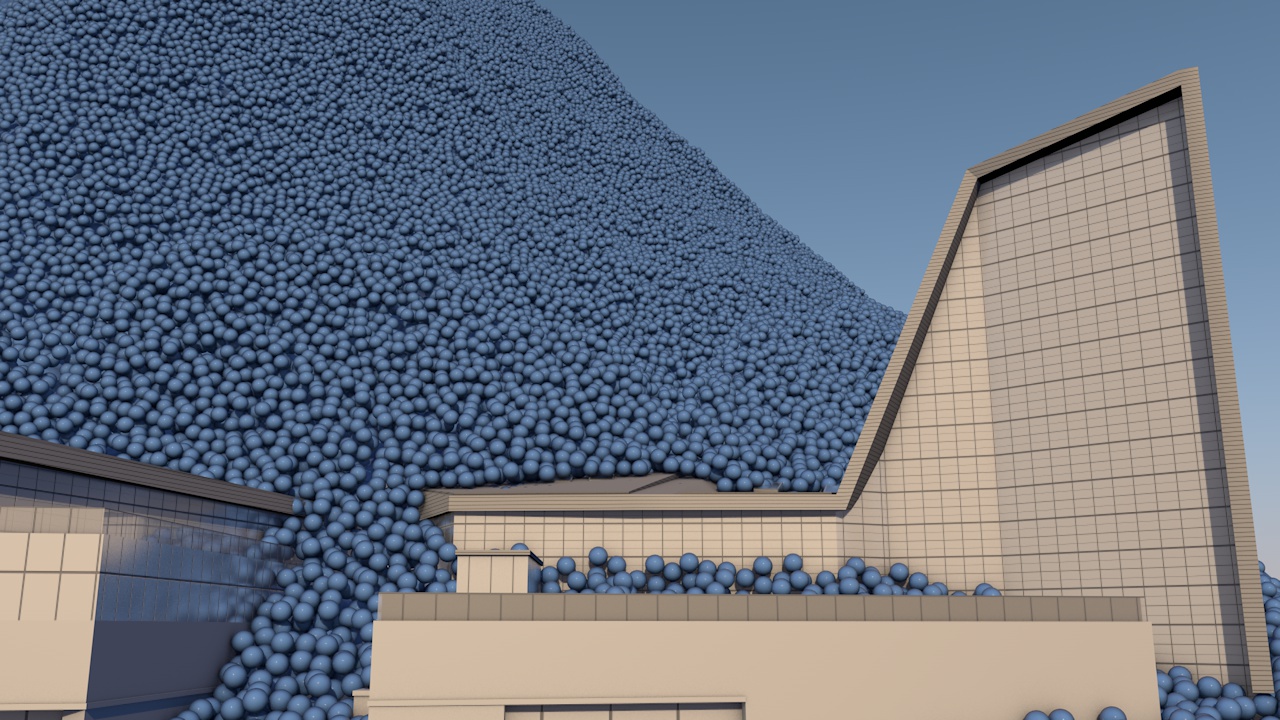
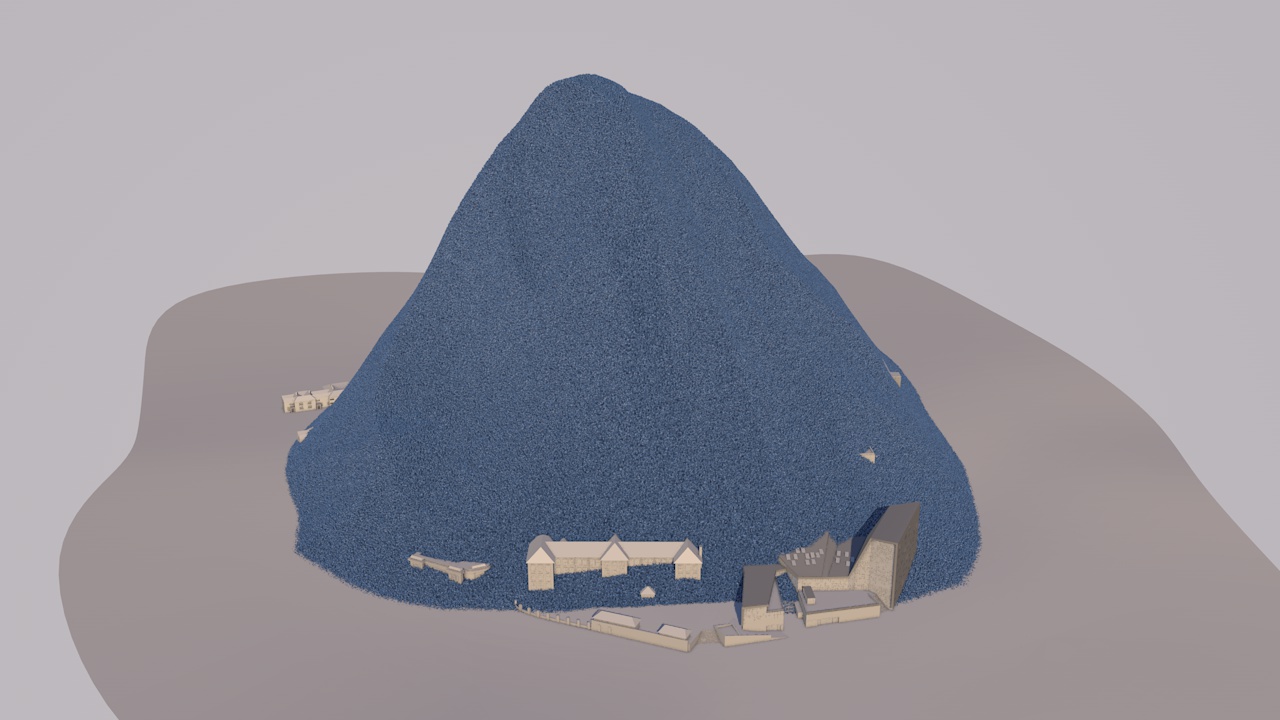
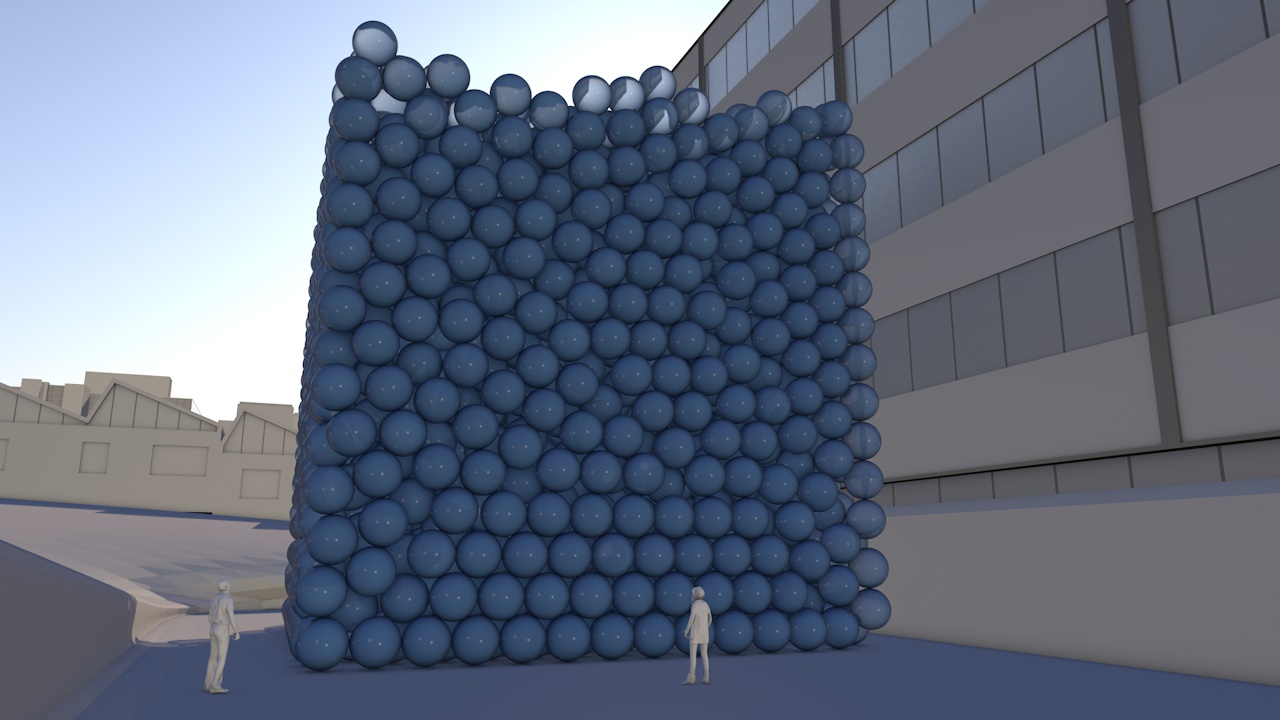
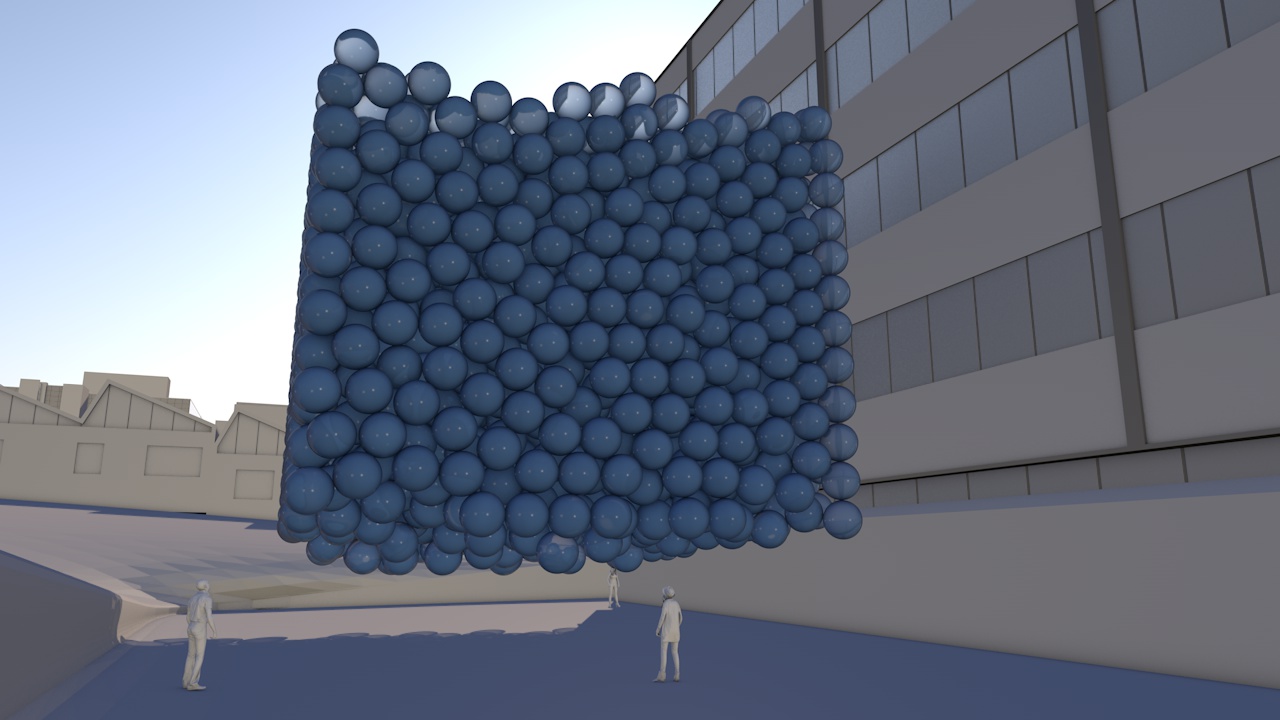
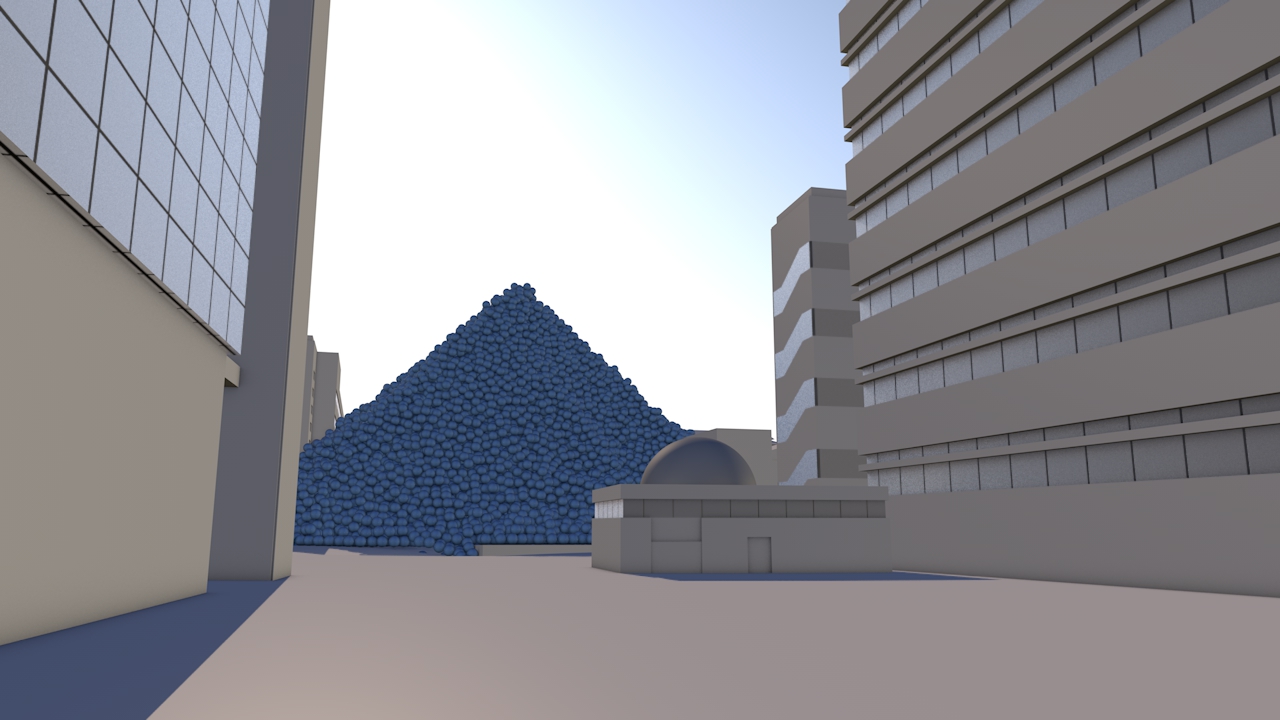
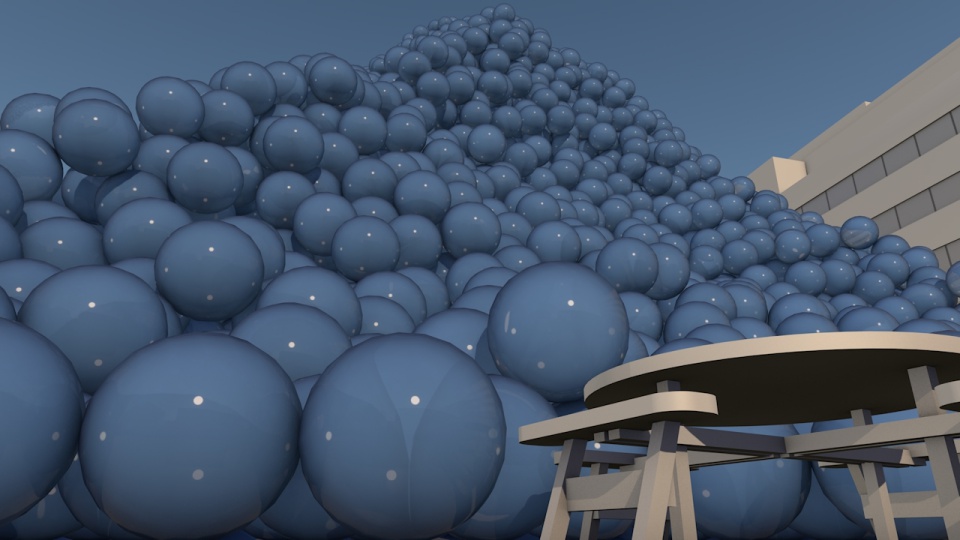
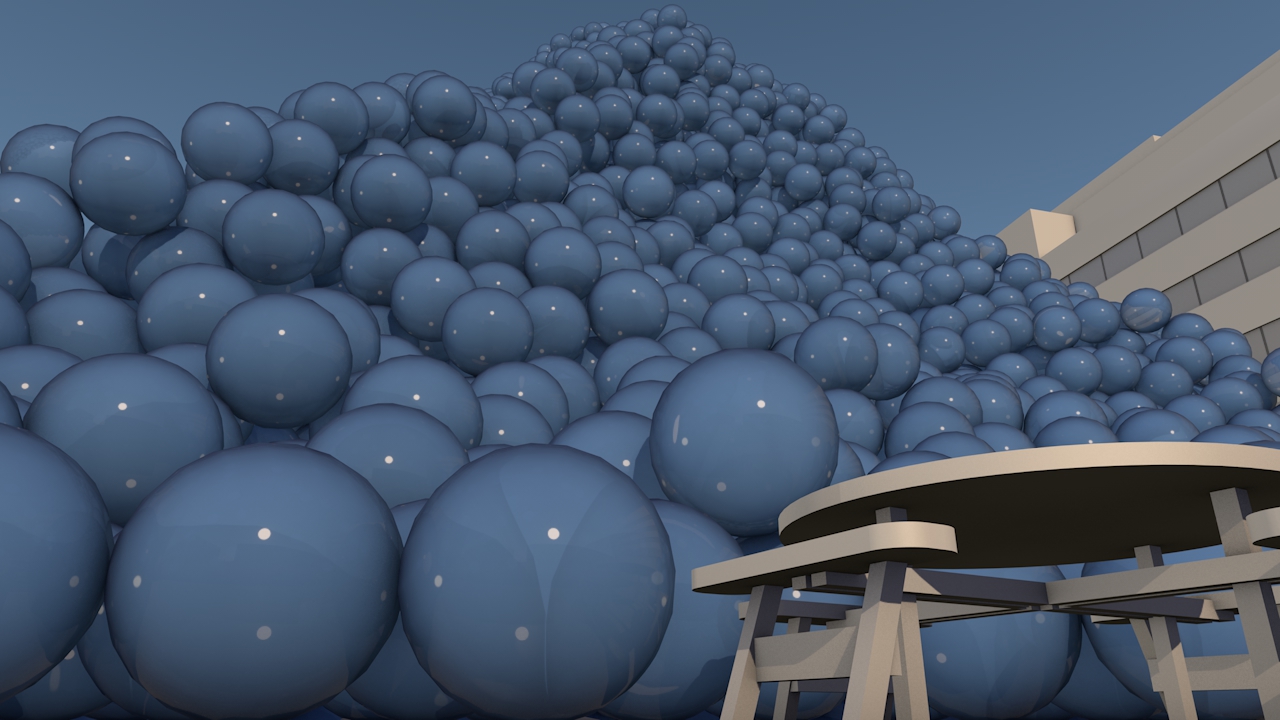
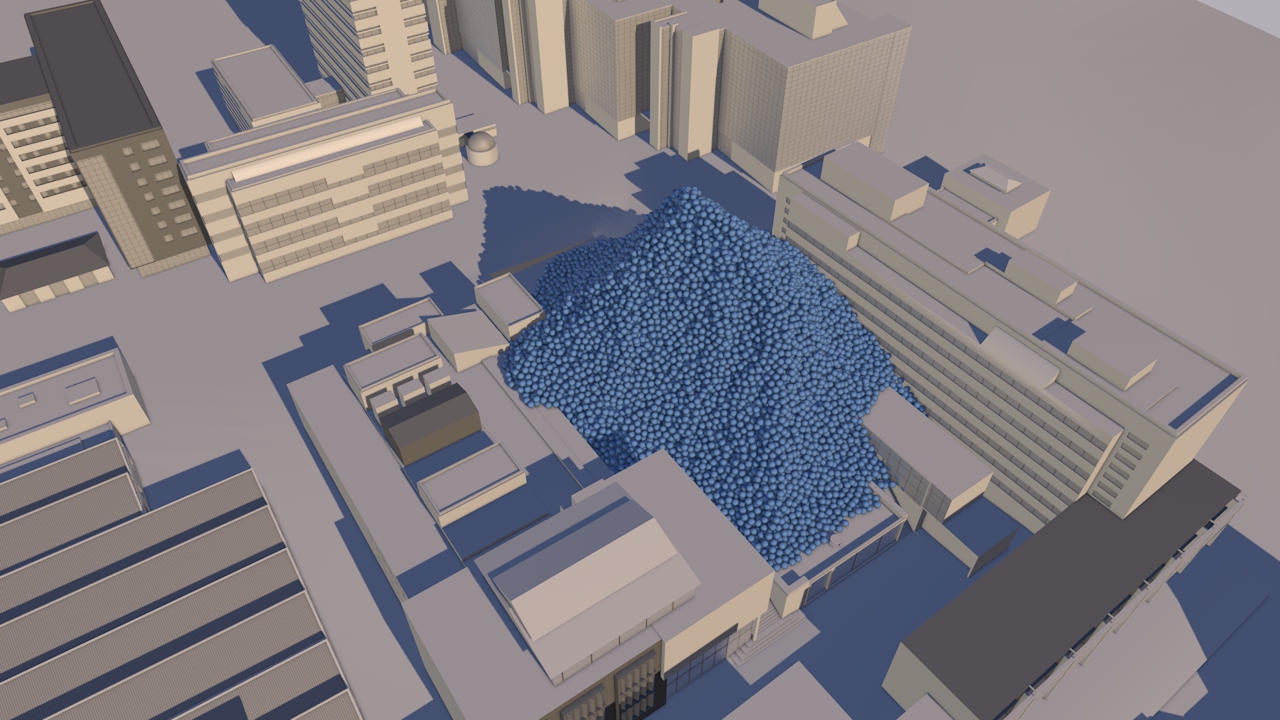
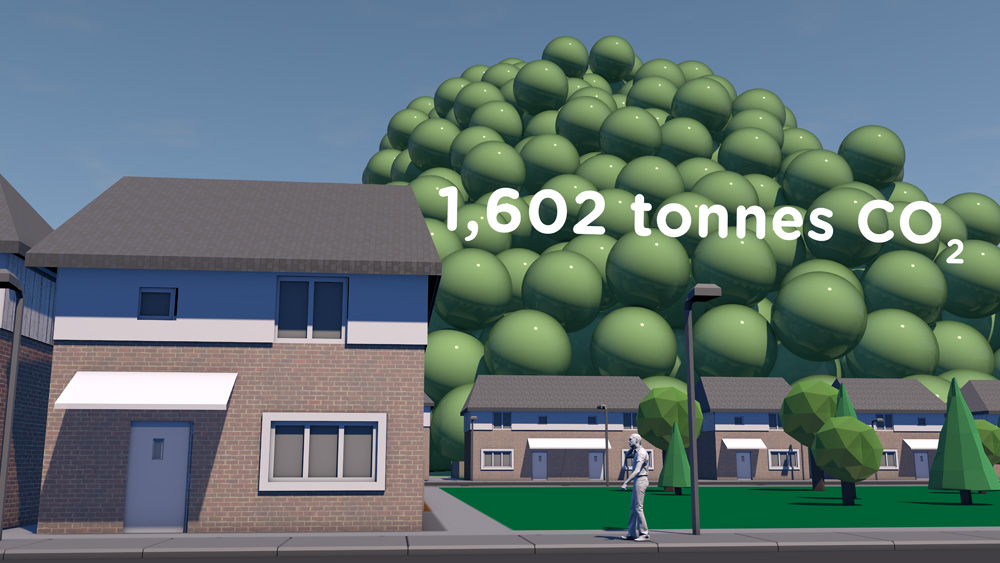
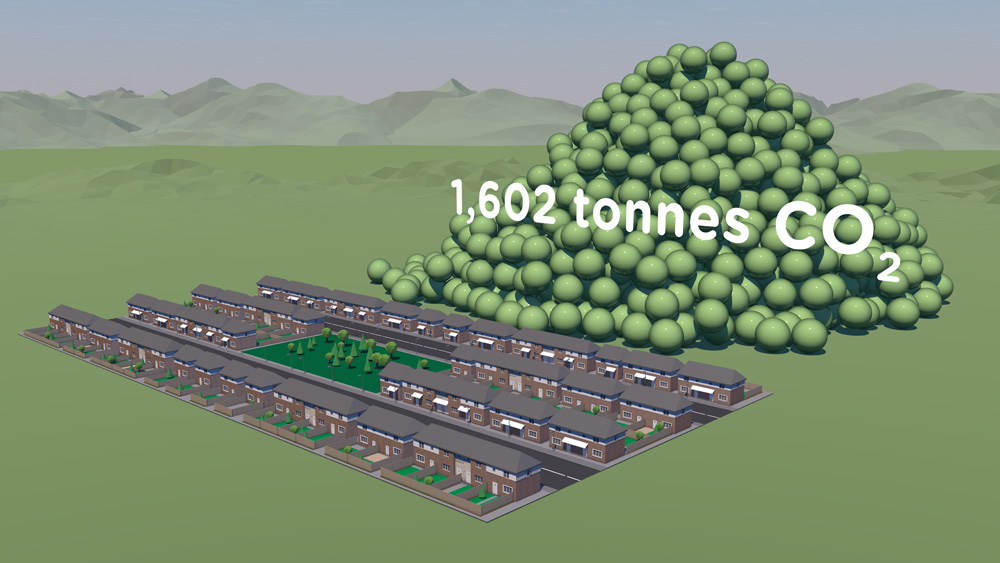
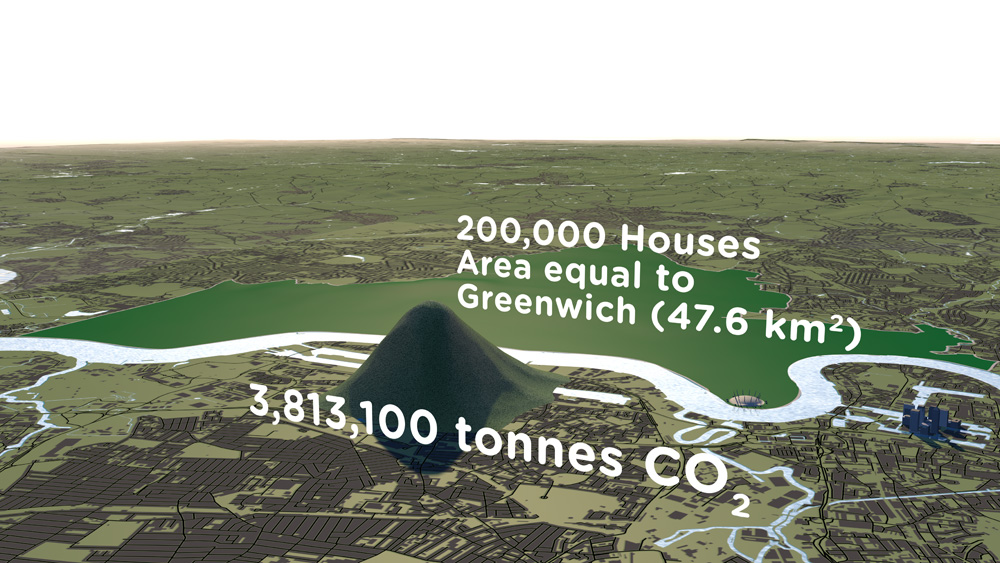
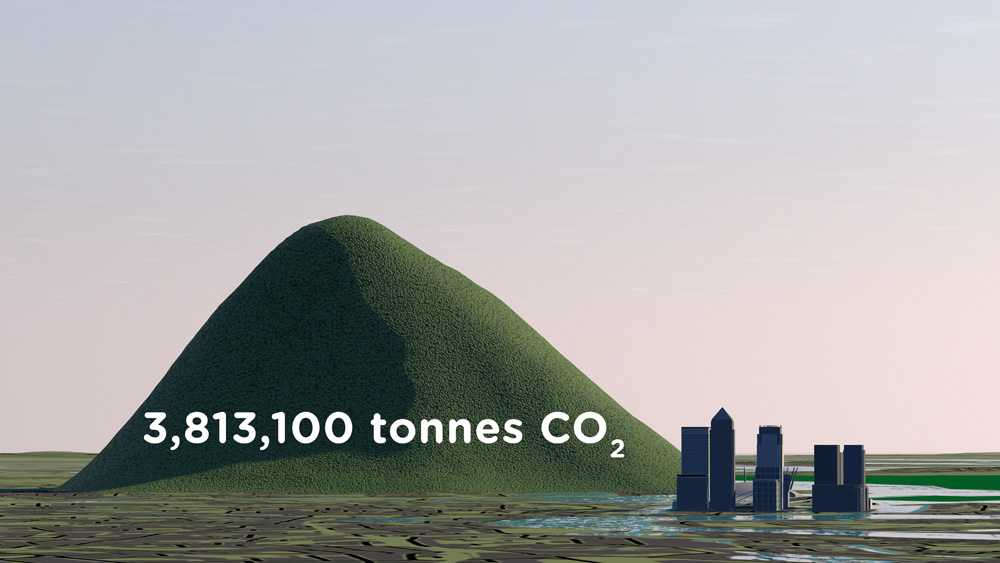
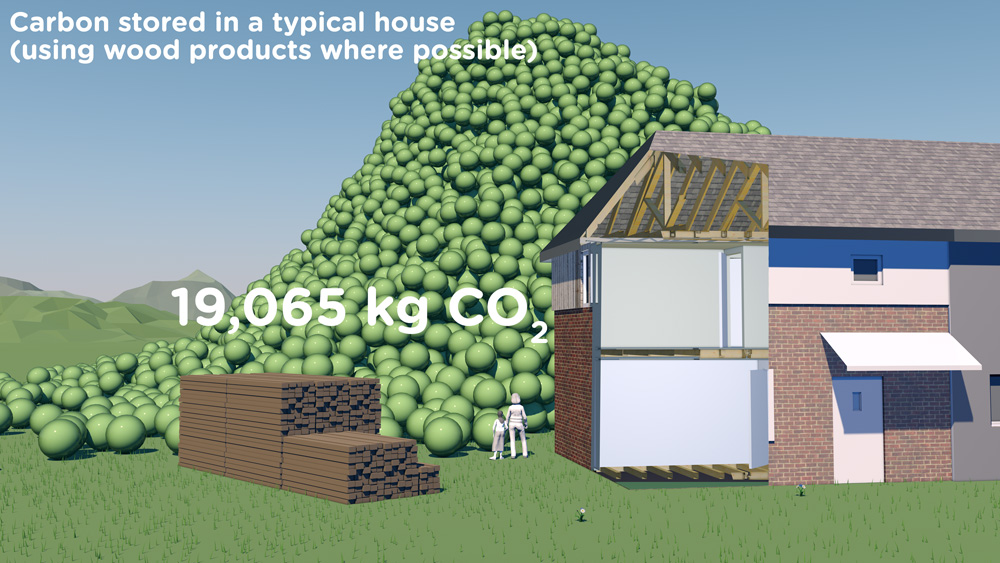
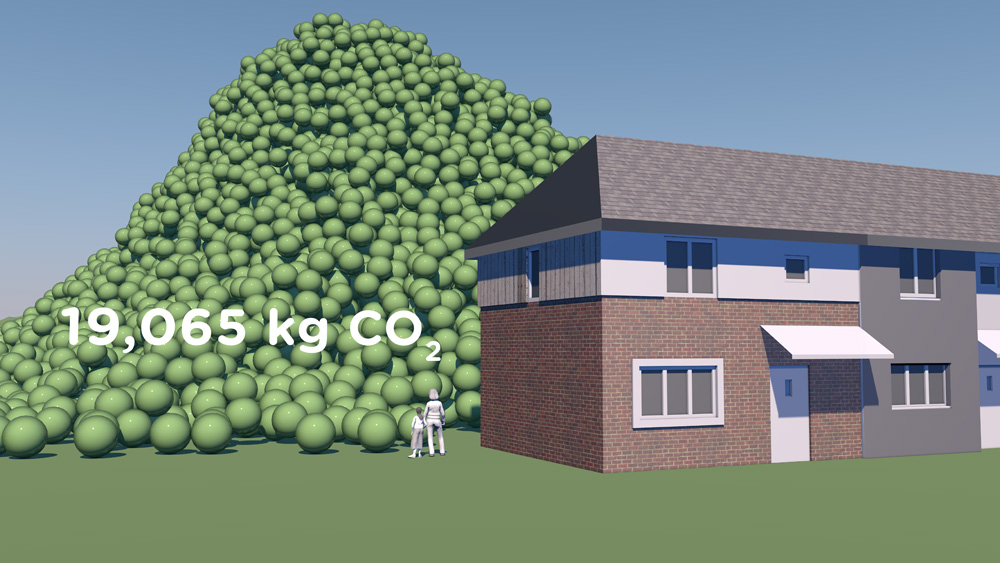
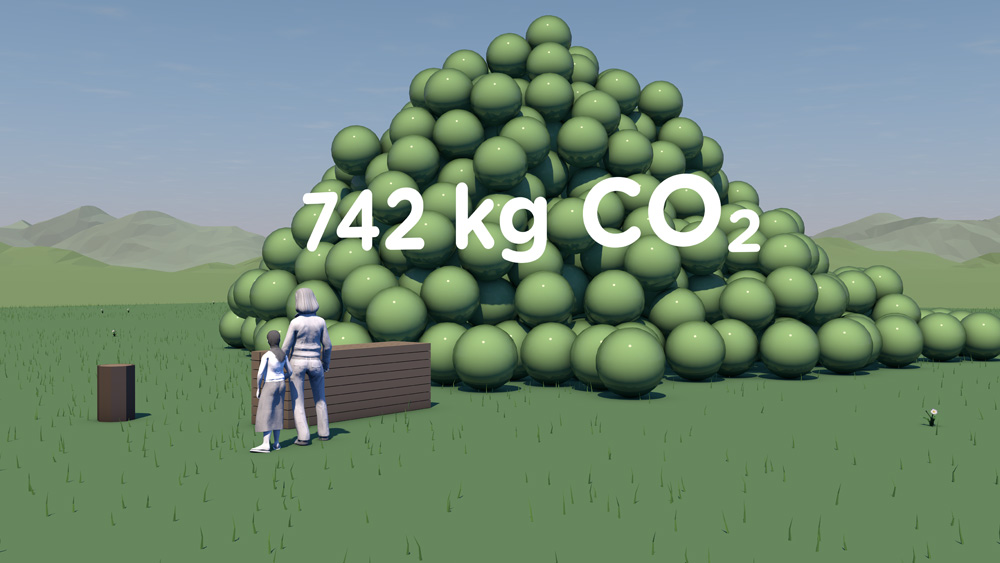
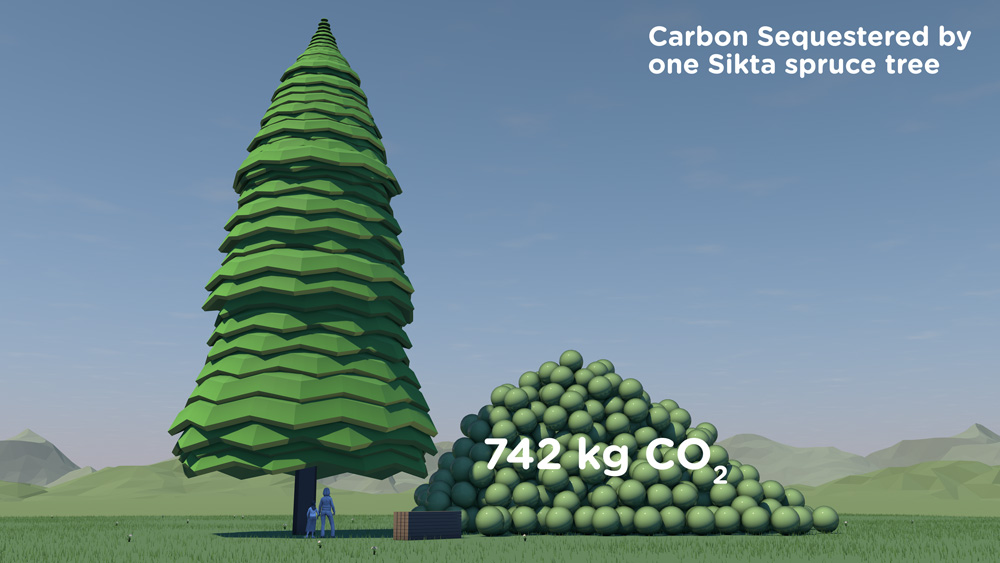
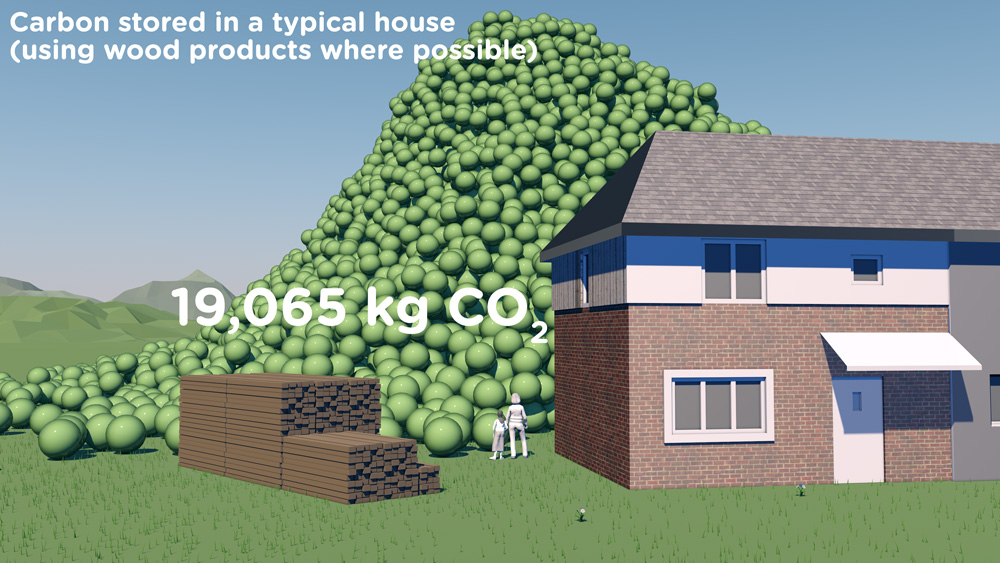
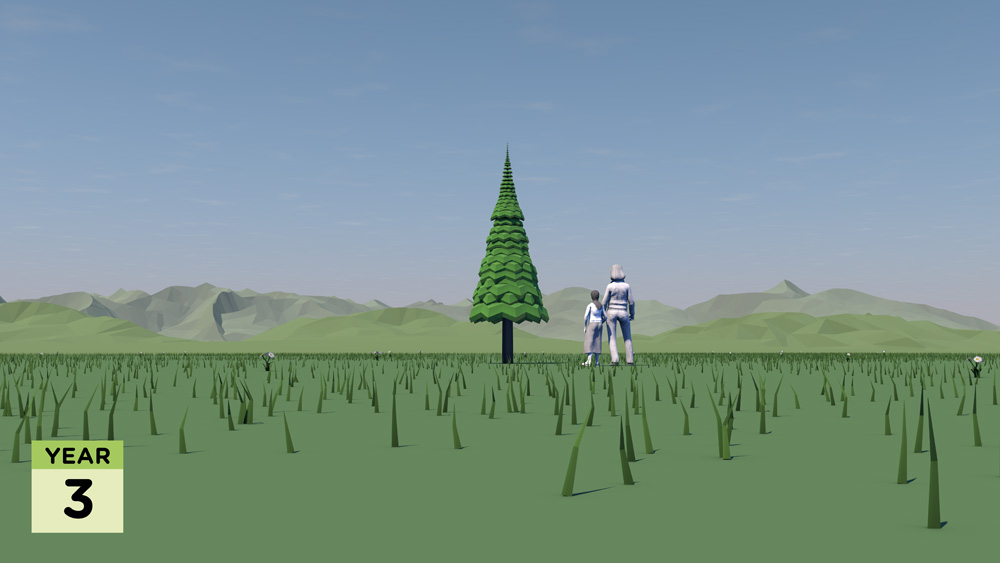
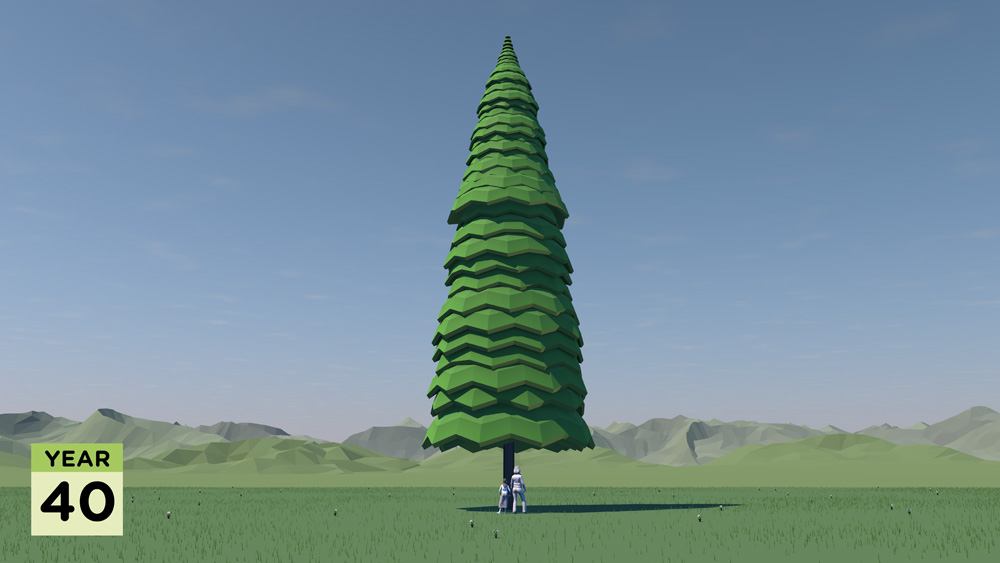
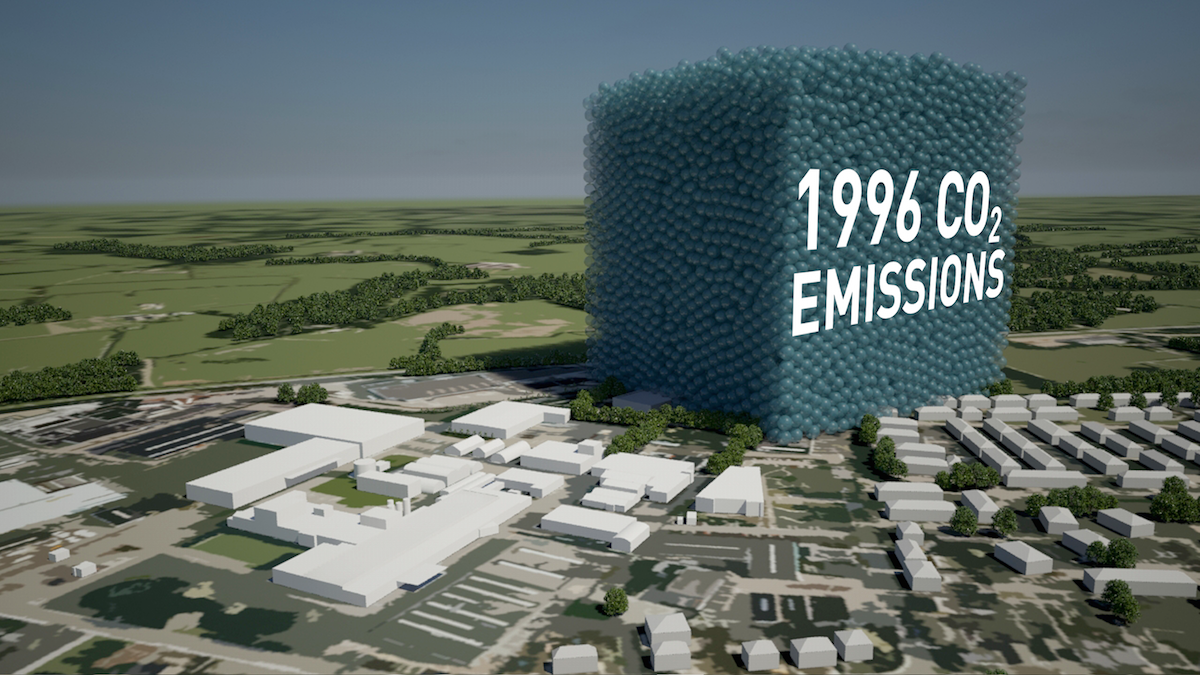
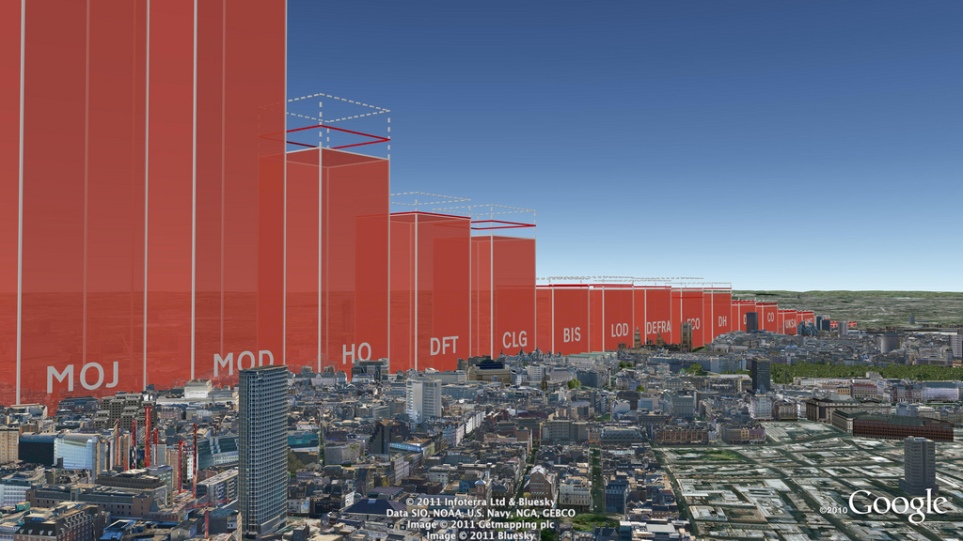
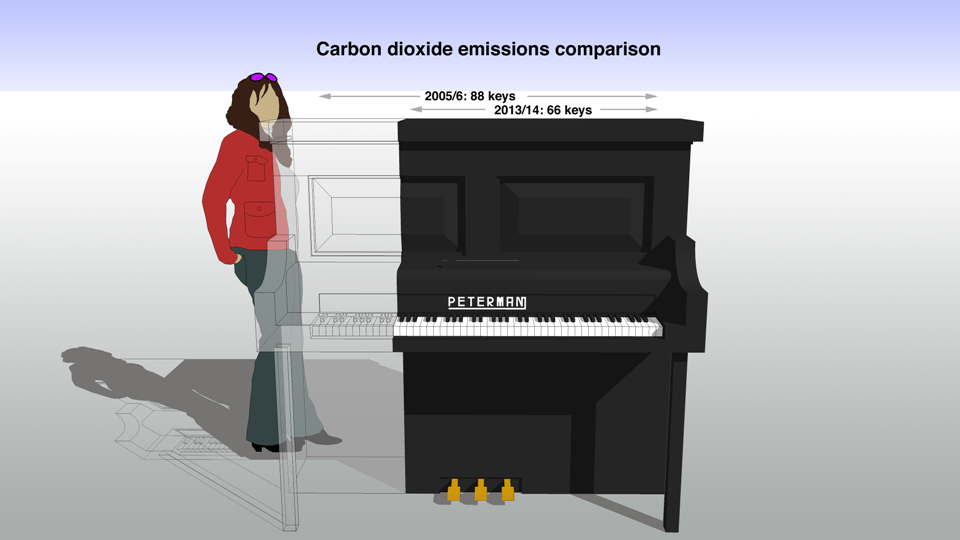
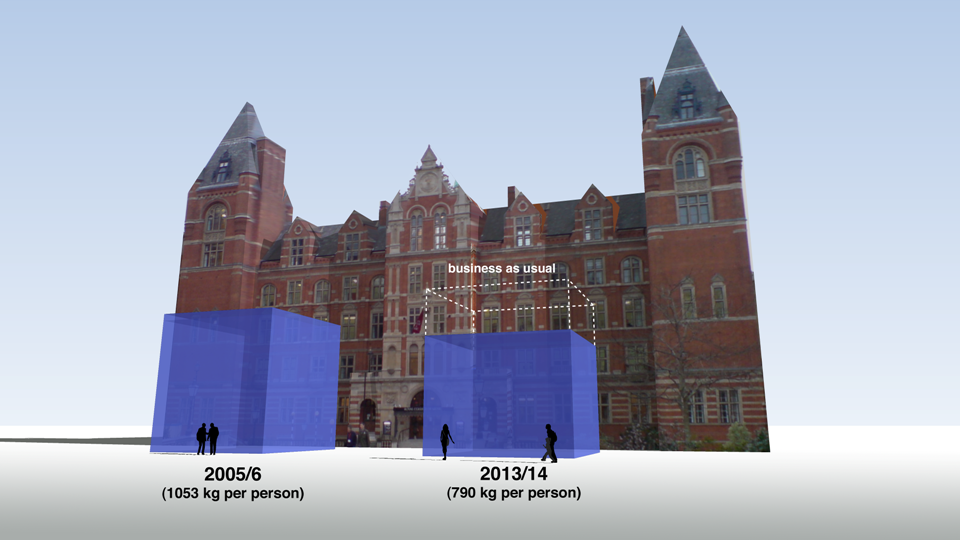
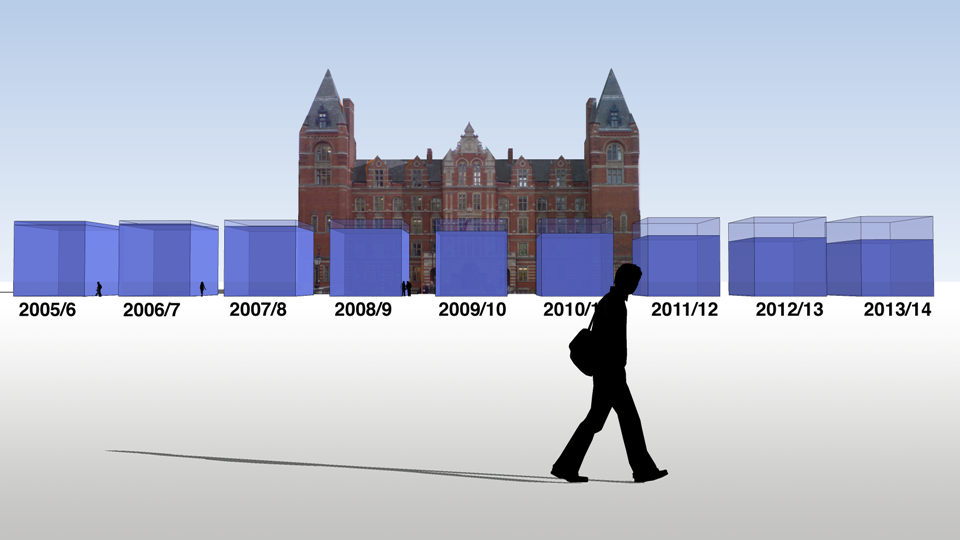
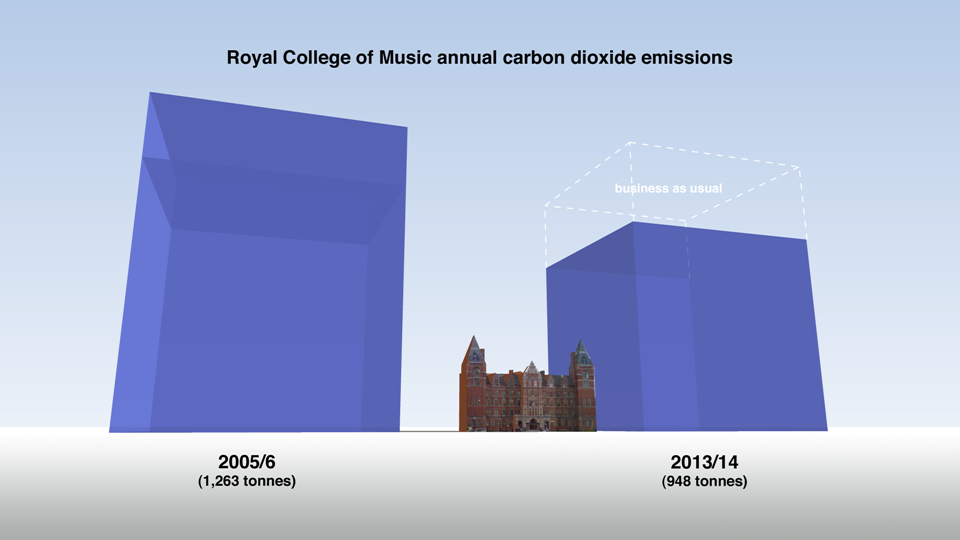
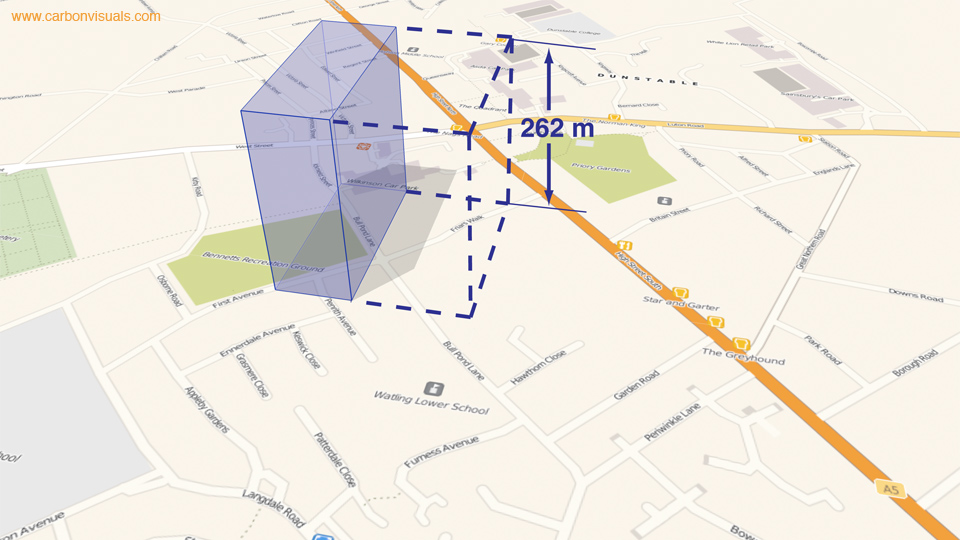
We are pleased to announce that we are developing an app which allows viewers to ‘see’ the volumetrically accurate carbon emissions associated with household appliances, furnishings, vehicles, buildings, power stations... as real-time flows or bubble piles. Furthermore, using the app, sales teams and their potential customers will be able to compare services and products clearly showing the difference in emissions in the purchase of low-carbon options.

The ability to reach out to consumers through simple apps is very compelling.

Antony Turner, CEO Carbon Visuals

The ability to reach out to consumers through simple apps is very compelling. In addition we can design a complete sales solution around the app that engages and easily invites B2B or B2C customers to purchase low-carbon options.

Key features of the app include:

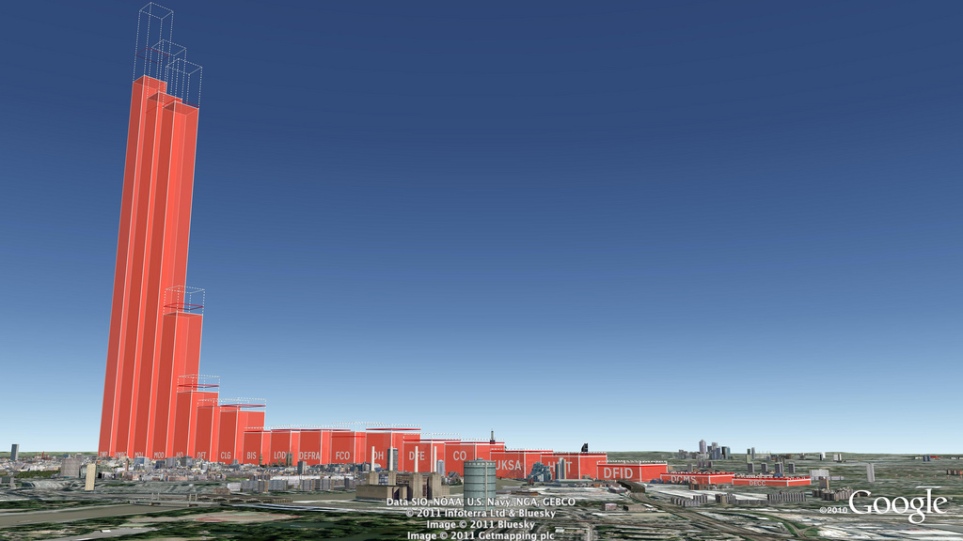
COMPARISON - shows the carbon footprint of products or services in comparison to your competitors

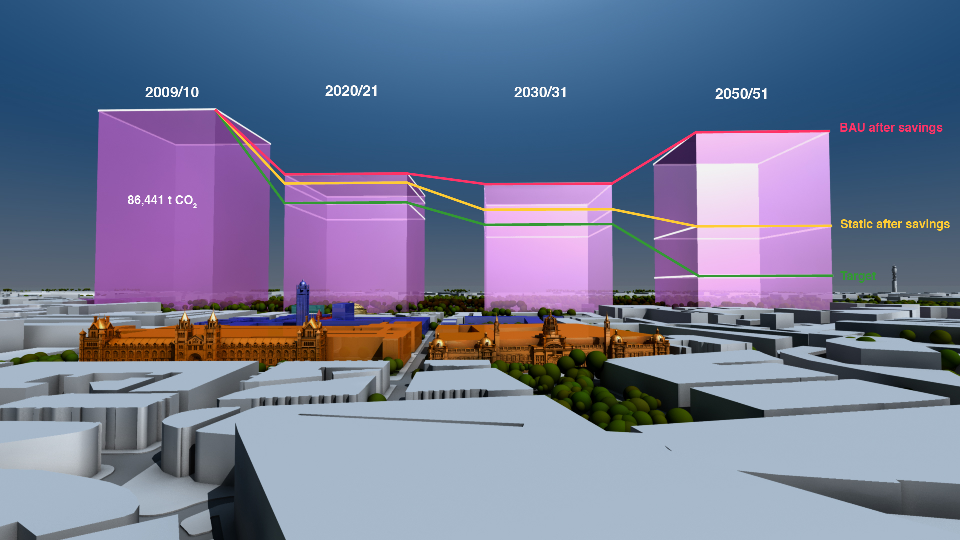
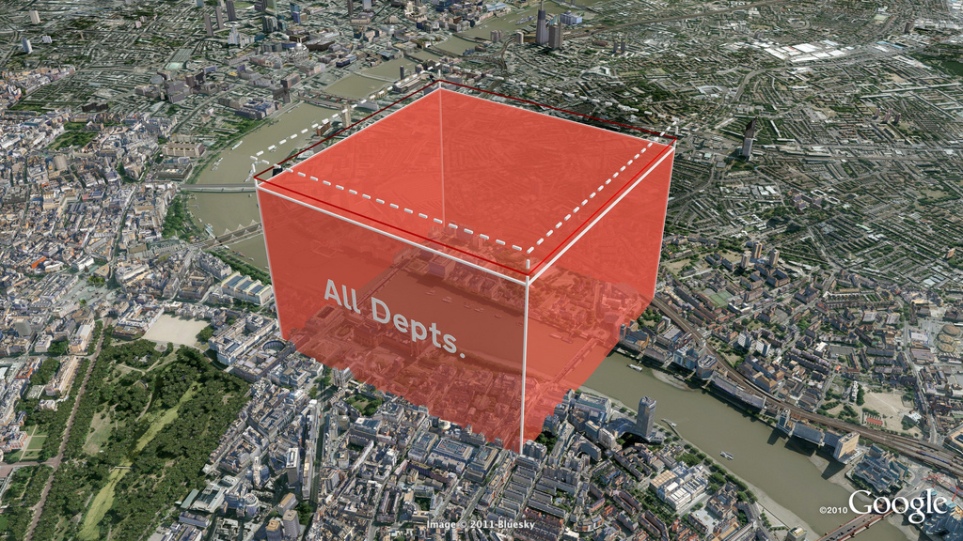
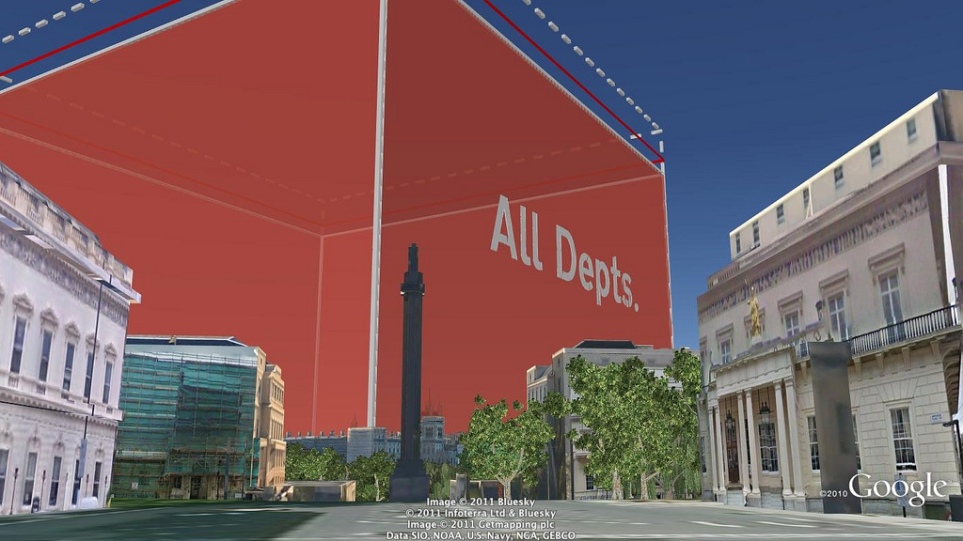
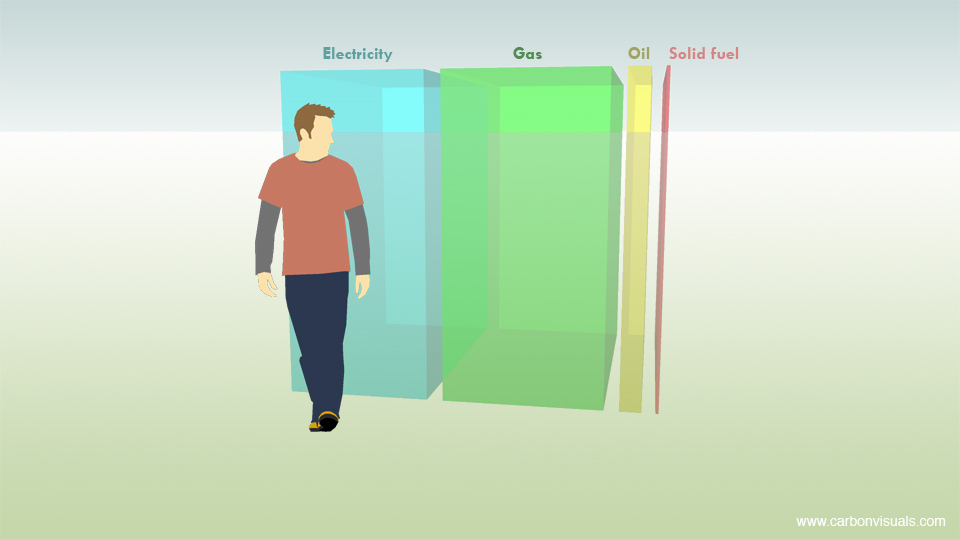
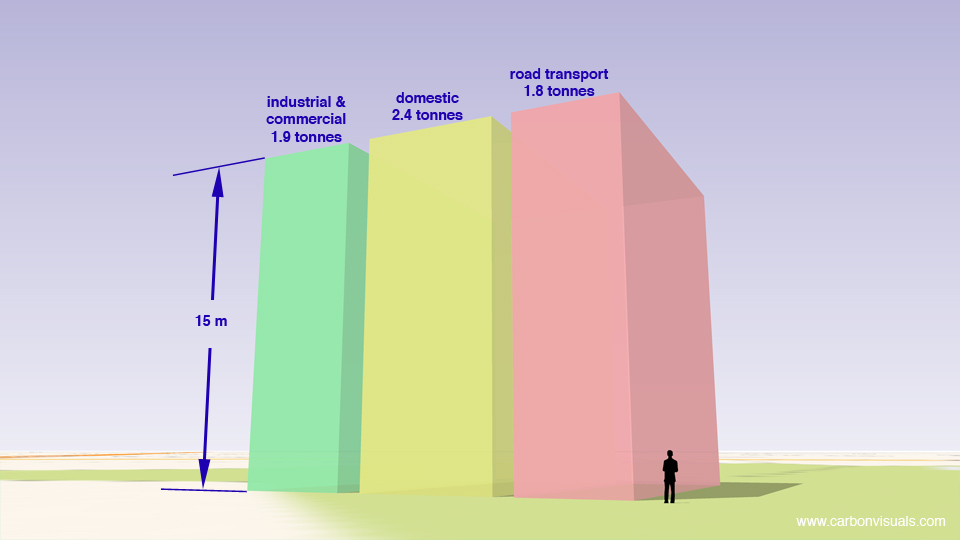
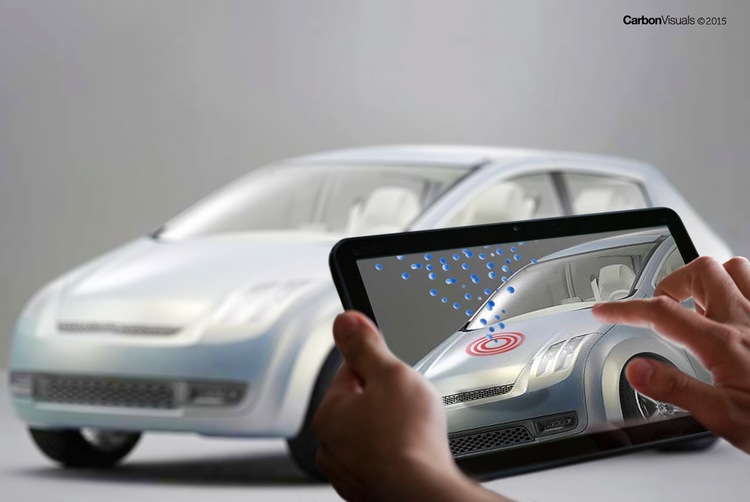
ACTUAL VOLUMES - demonstrates the actual volumes of CO2 as real-time streams or bubble piles / blocks

SHOW COSTS – combines with other important metrics e.g. costs

EASY-TO-USE - we work with your marketing team to create relevant and easy user interface within your sales campaigns

Versions are envisaged that highlight and compare low-carbon benefits of energy, vehicles, furnishings, building products etc.

For instance we can design a system for the green energy market where consumers are invited to buy energy that has a substantially lower carbon footprint than a fossil-fuel based energy mix. We envisage combining the technology with an elegant sales promotion campaign developed with the energy company's own marketing team.

Another example envisaged would be a version for use in car dealerships where new plug-in or eco-efficient cars are for sale. A simple set of questions about a customer’s existing car and journeys can allow the sales rep to immediately show the emissions associated with the 'old' car v the new model alongside financial savings.

Educational opportunities are limitless provided the data is available, and games-based versions could enable understanding of our 'high-carbon' world in a fun and sharable way.

To find out more about how this app could help your sales campaign, or to discuss other potential applications, please contact:

Antony Turner, CEO antony.turner@carbonvisuals.com

University of Plymouth - The Carbon Footprint

CLIENT

University of Plymouth

PURPOSE

To engage students, academics and staff, show emissions are real and that the University is endeavouring to achieve reductions.

DESCRIPTION

Animation showing the footprint using the campus itself for scale and including a success story where emissions have been reduced.

The University of Plymouth adds 11 thousand tonnes of carbon dioxide to the atmosphere every year. But what does that look like?

This animated film illustrates this footprint using the campus itself for scale and shows a ‘success’ story’ where emissions have been reduced.

The purpose of the video was to engage otherwise uninterested students, academics and staff, get them to realise that carbon emissions are real and show that the university is endeavouring to achieve measurable reductions. The intention is then to invite them to explore more detail through web-based energy and carbon dashboard.

The annual carbon reduction savings of 213,890 KgCO2e were achieved at the Babbage building after lighting and IT upgrade, installing voltage optimisation and connection to the Combined Heat & Power (CHP) plant. These savings are expected to equate to the annual emissions of the new Marine Building.


FURTHER INFORMATION

University of Plymouth Carbon Management Plan 2010 - 2015 here.

Sustainability pages for Plymouth University here.


Making sense of carbon, trees and timber

CLIENT

Wood for Good

PURPOSE

To find a new way to communicate the carbon benefits of using wood and timber in the UK construction sector.

DESCRIPTION

A series of short animated films and case study images using Wood for Good’s data to reach construction professionals, policy makers and the public.

The competence and skill you have in handling large data sets is absolutely fantastic. And you still delivered a wonderful set of visuals for us that we can continue to use for a long time to come.

Craig White Chairman, Wood for Good

How much carbon is stored in a tree? How does that translate into cut timber and wood products? And how much carbon can be ‘banked’ by using timber for building houses in the UK?

These questions are raised and answered in a communication project that includes a series of short animated films and set of case study images created by Carbon Visuals for Wood for Good, the UK's wood promotion campaign.

The aim was to find a new way to communicate the positive carbon benefits of using wood and timber in the UK construction sector not just to construction professionals but also policy makers and the public.

Given the wide nature of the brief we agreed with the client to start the project with a scoping phase. During this, it was decided to split the film into three separate sections that could each work as short stand-alone films, rather than only as one single complex narrative. In addition we agreed to create a set of case study best practice images showing the carbon ‘banked’ in high profile buildings and timber products.

It has been very satisfying to shape and create a project which has both a business focus and important educational potential. I would like to see us working with more trade bodies and campaigns that have an important carbon message to get across.

Antony Turner, CEO Carbon Visuals

By liaising closely with the client in this initial phase we were able to spend time working up a communications plan, sourcing and examining appropriate data and creating draft film storyboards. This established a sound basis for the production schedule, culminating in all visual materials being ready for the campaign launch.

Data Sheet with methodology, data and references available here.

See Wood for Good website page here.

See our post-production video (giving insight from our clients on the project) here.

Visualising a 90% carbon reduction

CLIENT

Interface

PURPOSE

To show the 90% carbon reduction achieved since 1996 at the European manufacturing facility in the Netherlands.

DESCRIPTION

Short animation that can be used on social media together with before and after images showing the Scherpenzeel factory and surroundings with the dramatic reduction in emissions.

In the past three years we have taken huge strides towards our Mission Zero goal.
To put it in context, we are now operating our European factories with a 90% reduction in greenhouse gas emissions compared to 1996 while the EU Commission has set an EU carbon reduction target of 40% by 2030.

Rob Boogaard, CEO Interface Europe

Carbon Visuals has helped Interface, the carpet tile manufacturer and pioneer in corporate sustainability, show the impressive 90% carbon reduction achieved since 1996 at its European manufacturing facility in the Netherlands.

We created a 3D model of the Scherpenzeel factory and surrounding area and populated it with our trademark ‘carbon bubbles’. Deliverables included volumetrically accurate ‘before’ and ‘after’ images as well as a short animation that can be used on social media or as part of a longer video.

See this animation on YouTube

Interface info on achieving 90 carbon reduction

Infographic illustrating how the emissions reduction has been achieved.

Video: A better way - Interface Europe achieves 90% CO2 reduction

Mapping local air pollution in New York

Visual images created by Carbon Visuals are being used to help New York property managers, building co-op boards and community groups reduce local air pollution from their buildings.

Around 8,000 buildings in New York City have been burning heavy heating oil. These contribute more soot pollution than all cars and trucks on the City’s roads. The NYC Clean Heat program seeks to improve air quality and save lives in New York by eliminating heavy oil use and accelerating the adoption of cleaner fuels

Emissions saving of Coati House at Paignton Zoo

Carbon Visuals has created an image to illustrate the energy saving of the highly insulated Coati House at Paignton Zoo. The sustainable building uses recycled plastic, green oak sleepers, FSC timber and 150mm thick black mountain sheep wool insulation so that heating is not required.

Without this insulation the zoo would have installed a 4kW electric heater. The image shows the actual volume of CO₂ that would have been emitted every day or every hour by such a heater.

Paignton Zoo Environmental Park, is a combined zoo and botanic garden in the South West of England that welcomes over half a million visitors a year.

New York's carbon emissions - in real time

In 2010 New York City added 54 million metric tons of carbon dioxide to the atmosphere, but that number means little to most people because few of us have a sense of scale for atmospheric pollution.

Carbon Visuals, supported by Environmental Defense Fund, have created a film that makes those emissions feel more real - the total emissions and the rate of emission. Designed to engage the ‘person on the street’, this version is exploratory and still work in progress.

The carbon canyons of New York

Seventy five percent of New York City's greenhouse gas emissions come from the energy used by buildings. Reducing this energy is a goal of both building managers and the City of New York itself.

This visualisation takes data about the carbon emissions of municipal buildings in New York City and transforms it into a 3D map of the actual volume of carbon dioxide added to the atmosphere. It co-opts the city itself to serve as its own data visualisation.

USA specific image set

A set of simple images was created to give context to other visualisation projects we were carrying out for US-based Environmental Defense Fund.

Using a model of a typical US house, combined with US metrics - tons, gallons etc. - helps make the images more real for Americans.

Sequestered carbon in innovative building panels

ModCell is a novel and innovative building system that brings the benefit of straw bale construction - exceptional levels of insulation - into the mainstream of the construction industry. Carbon Visuals was asked to provide images to show the sequestered carbon dioxide in panels and in a recently completed project - a school science centre in Bath.

Building Confidence

The Building Confidence Project emerged from an energy 'data-jam' at the Google offices in New York to which Carbon Visuals was invited. It was organised by the White House to generate new approaches to energy efficiency.

The project idea, facilitated by Honest Buildings, was to create a database of energy efficiency projects that can inspire and facilitate similar initiatives elsewhere. Carbon Visuals' role was to consider the role data-graphics could play in reaching wider audiences.

Barts NHS Trust Estates Strategy

Barts Health NHS Trust was formed in 2012. It is the largest in the country with multiple sites and major projects planned and underway. For presentation of the Estate Strategy we created 3D models and a map=based animation that showed, in simplified form, development and other planned changes over a five-year period, together with data for water, gas and electricity usage.

We also provided a set of images for use in other presentation formats and media.

Visualising the greenhouse gas emissions for London’s Strategic Health Authority

Carbon Visuals was commissioned by UCLH (University College London Hospital), to create a set of images and a short animated film depicting the carbon footprint of all London's hospitals and NHS Trusts.

The visuals are used in conferences and workshops where facilities and energy personnel, as well as a wide range of other stakeholders, can get a better understanding of actual emissions, emissions reductions and the differences between different hospitals.

Real-time Energy & Carbon Displays for Devon Visitor Centre

Carbon Visuals has created real-time energy and carbon visualisation displays for a new Visitor Centre at Occombe Farm, a working organic farm that includes an award-winning farm shop, a cafe featuring local food and drink, a nature trail, an education centre and cookery workshops.

Supporting carbon literacy at Plymouth University

Carbon Visuals was invited to provide a set of images to illustrate the daily and annual carbon footprint of greenhouse gas emissions from selected buildings on the University of Plymouth campus.

The purpose of the project was to support carbon and energy-reduction activities by staff from the Estates Department. In addition the University is planning research to determine the effectiveness of this kind of communication with students, academics and staff.

Illustrating carbon reduction potential for South Kensington 1851 Estate

CLIENT

Natural History Museum, Science Museum, V&A, Imperial College and Royal Albert Hall

PURPOSE

To illustrate the carbon reduction potential for the South Kensington 1851 Estate.

DESCRIPTION

Striking image set, to illustrate the Carbon Reduction Masterplan launched by the Minister of State for Energy and Climate Change.

Carbon Visuals has created a set of striking images to illustrate the carbon reduction potential for the South Kensington 1851 Estate. Organisations involved include the Natural History Museum, the Science Museum, the Victoria and Albert Museum, Imperial College, the Royal Albert Hall, the Royal College of Music and the Royal College of Arts.

These prestigious institutions came together in 2005 to embark on an inspirational long-term carbon reduction plan. Phase One involved laying the foundations and creating a realistic strategy. The Masterplan, launched in November 2011, marks the conclusion of that phase and the commencement of its realisation.

Carbon Visuals aided communication amongst the parties and with external stakeholders by creating striking imagese at various stages of the project.

Creating a computer generated model of the Estate enabled a wide range of different images to be created - wide angle, close-up, aerial and ground level.

To see the context in which the images were used feel free to download the PDF of the overview brochure.

UK Government departments exceed their 10% CO2 reduction targets


Carbon Visuals was commissioned by DECC to produce a set of high-resolution Google Earth images to illustrate Government department carbon footprints and reduction targets. The total carbon dioxide emissions between May 2010 and May 2011 amounted to 646,231 tonnes, which is 13.8% less than the previous year. This is what that looks like.

The actual volume of carbon dioxide gas emitted by the UK Government in 2010/11 (red volume). The saving on 2009/10 - the gas that didn't enter the atmosphere - is shown as the dashed volume. The target is shown as a red band.

See the Government press release here:www.decc.gov.uk/en/content/cms/news/pn11059/pn11059.aspx

Download the PDF with more info

Bringing the Royal College of Music carbon management plan to life


The Royal College of Music worked with the Carbon Trust to develop a Carbon Management Plan, which was published in July 2010. The Plan highlighted a number of actions that could be taken to reduce emissions by 25% by 2013/14.

A key part of the Plan was to get students and staff engaged in the issues, so Carbon Visuals were invited to find innovative ways to communicate the carbon footprint and emissions reduction targets.

It was a very worth while project and has been a well recieved way of getting this difficult message across

Matthew Nicholl, Building Project Manager, Royal College of Music

To turn abstract numbers into quantities that viewers could relate to physically, we used a depiction of the College building. We also proposed a way for musicians in particular to gauge a 25% reduction – it’s like losing nearly two octaves from a piano.

Some of these images are being used for posters, leaflets and presentations to help staff and students have a better understanding of their carbon footprint and create ‘ownership’ of reduction plans and targets.


Helping local government involve all staff in emissions reduction

Central Bedfordshire Council needed a way to involve key stakeholders and staff in meeting targets for emissions reduction. We produced volumetric visualisations that make reference to landmarks and areas that these audiences can relate to.

We also produced animations that bring the figures to life by showing the emissions from different council activities in real-time. The Council used the visualisations in a stakeholder conference but they also found them useful for new employees, strategy documents, and the Council’s website.

These visualisations are a huge breakthrough and will enable people to clearly see the impact our carbon emissions are having on the environment and the level of responsibility that falls on each one of us to assess and change our activities.

Councillor Richard Stay, Deputy Leader, Central Bedfordshire Council