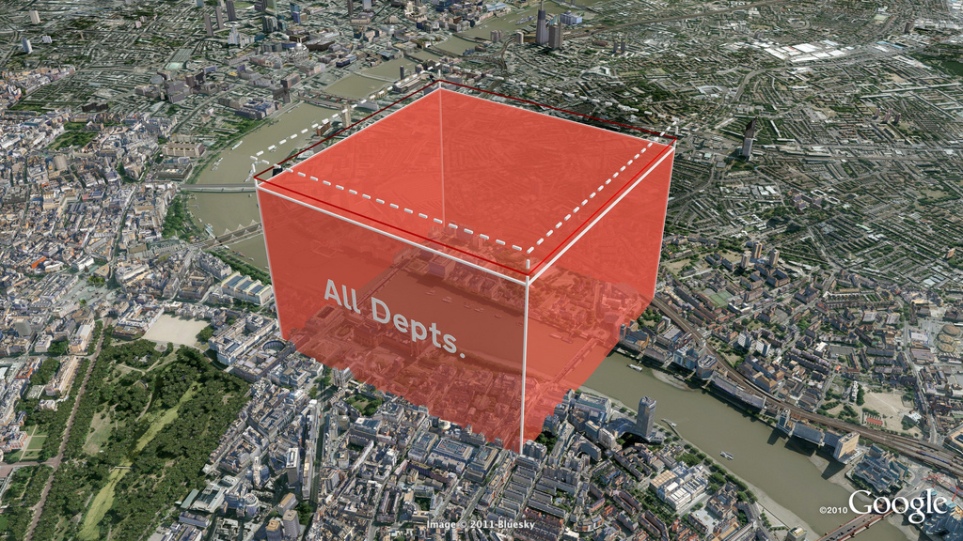
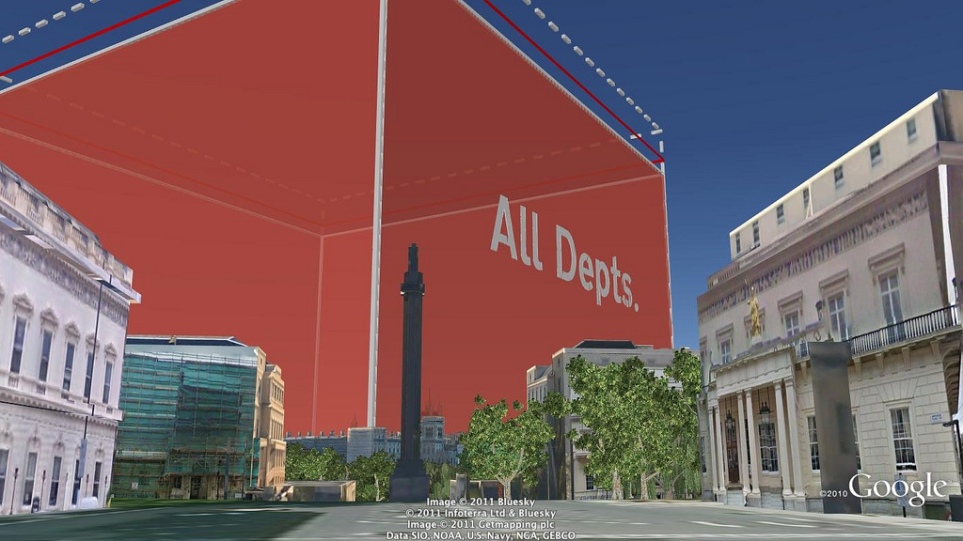
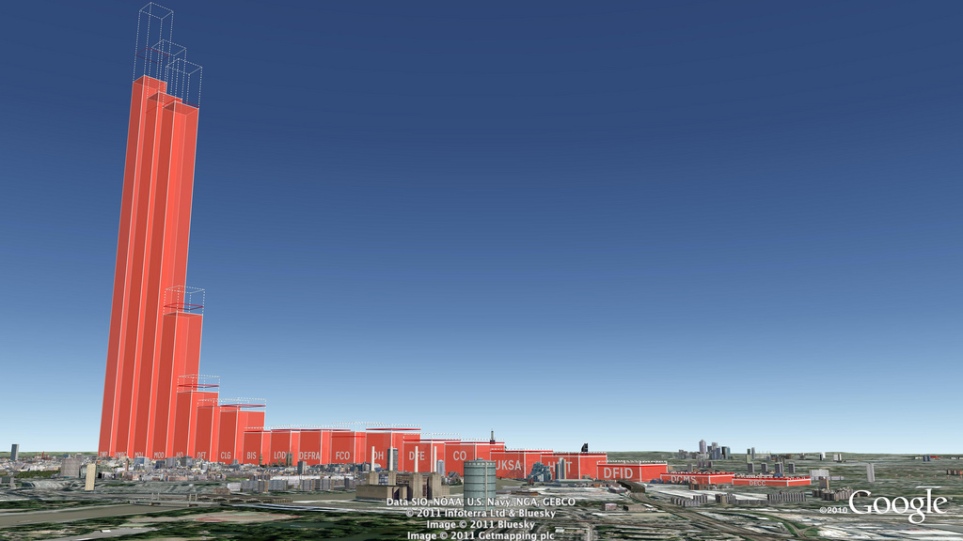
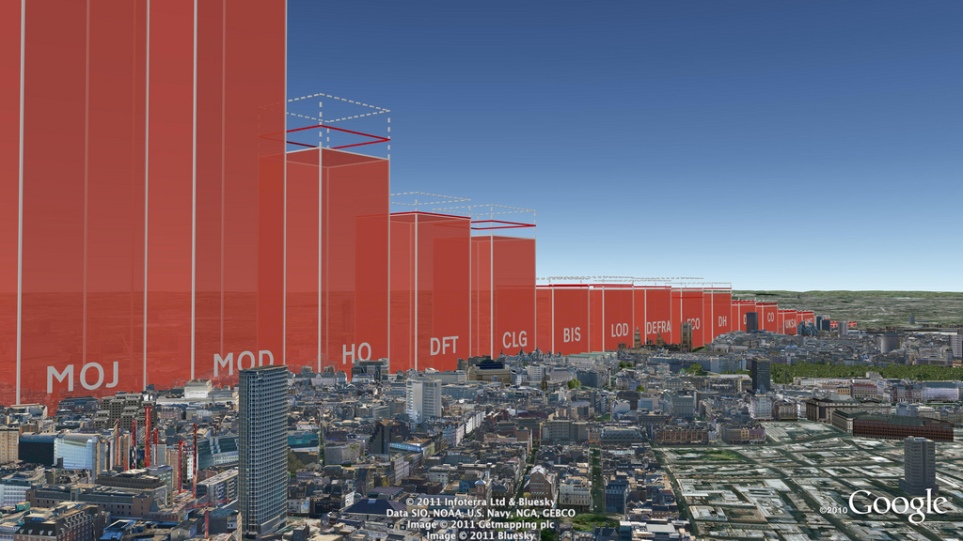
Carbon Visuals was commissioned by DECC to produce a set of high-resolution Google Earth images to illustrate Government department carbon footprints and reduction targets. The total carbon dioxide emissions between May 2010 and May 2011 amounted to 646,231 tonnes, which is 13.8% less than the previous year. This is what that looks like.
The actual volume of carbon dioxide gas emitted by the UK Government in 2010/11 (red volume). The saving on 2009/10 - the gas that didn't enter the atmosphere - is shown as the dashed volume. The target is shown as a red band.
See the Government press release here:www.decc.gov.uk/en/content/cms/news/pn11059/pn11059.aspx