CLIENT
World Business Council for Sustainable Development
PURPOSE
To engage world leaders, industry experts, campaigners and scientists at the UN Climate Summit, New York, September 2014 and to catalyse and inform conversations about reducing carbon emissions.
DESCRIPTION
Film showing actual quantities of global fossil fuel consumption and carbon emissions, and the part that carbon capture and storage can play in limiting global climate change to 2 degrees.
Among all of the documents, reports and images being released around the UN summit, we hope that this film will stand out and benefit all participants, as well as anyone who watches it around the world.
Peter Bakker President, WBCSD
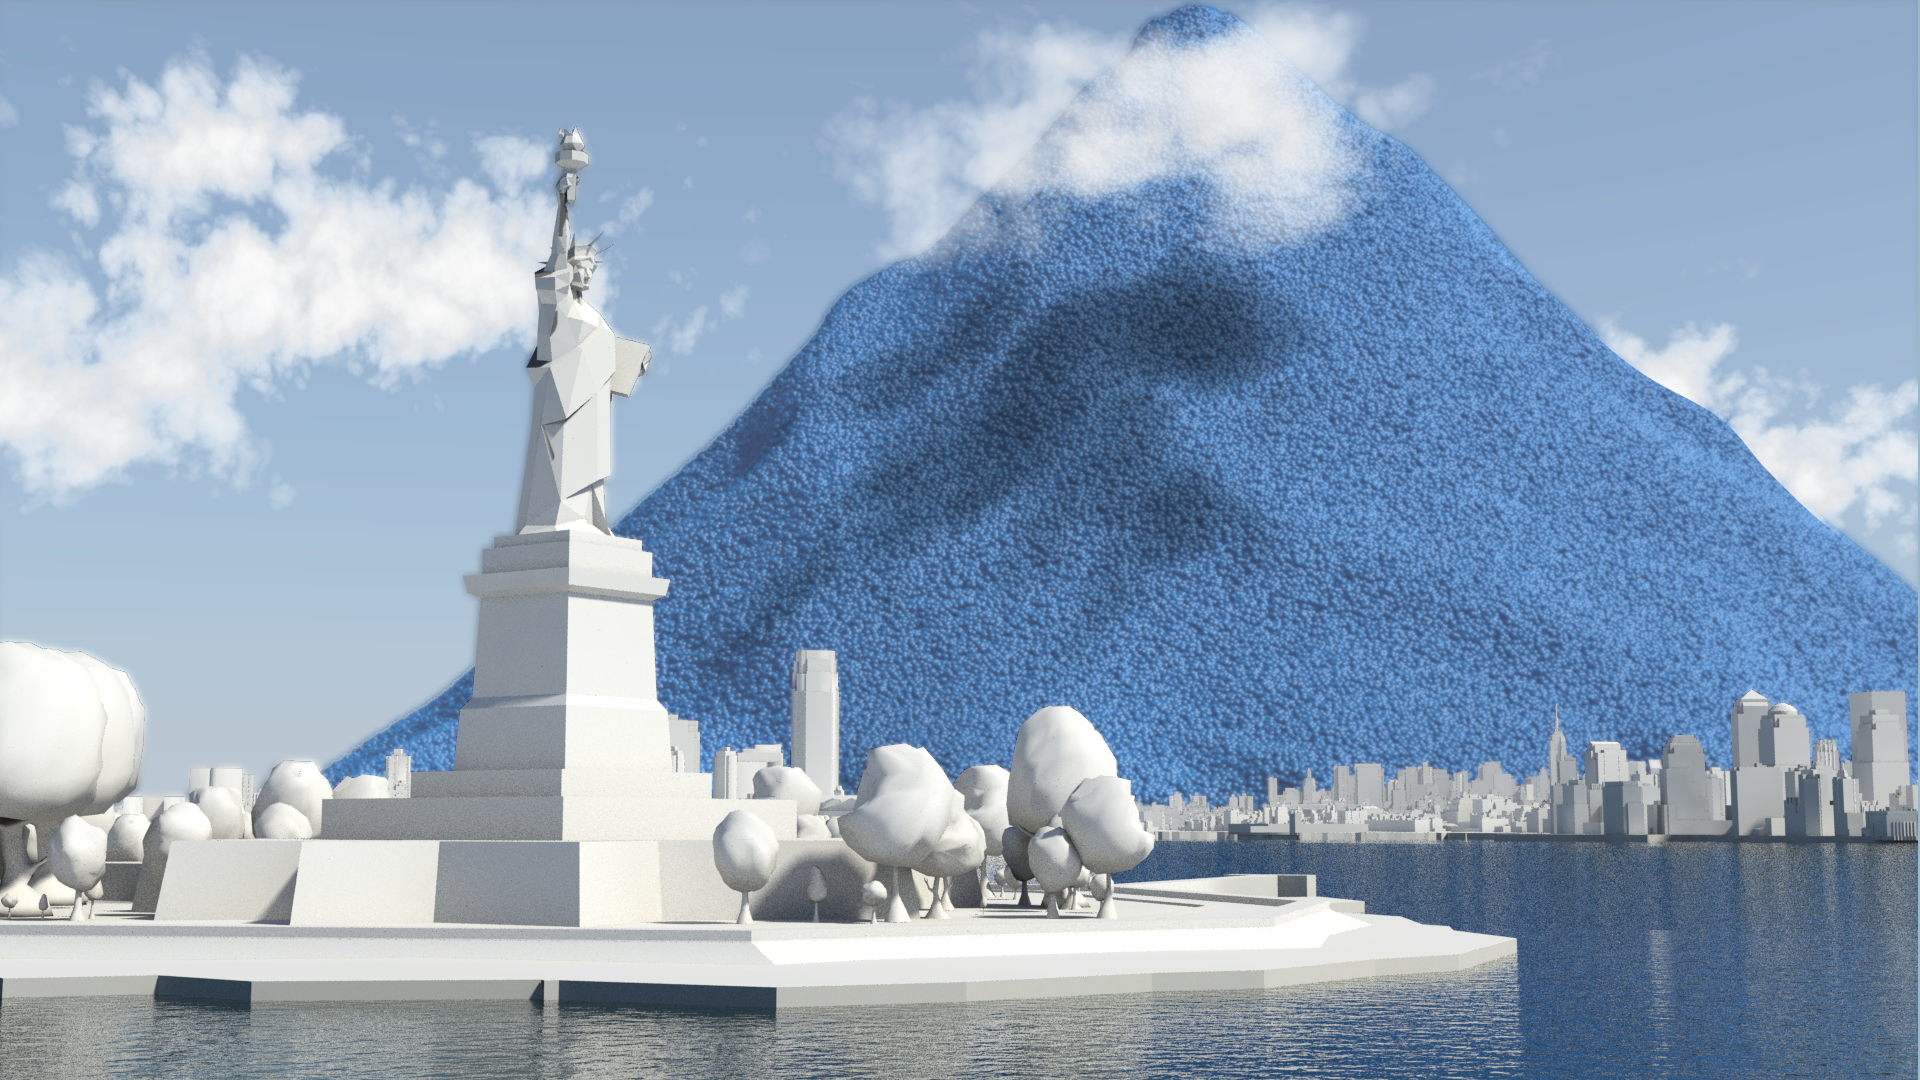
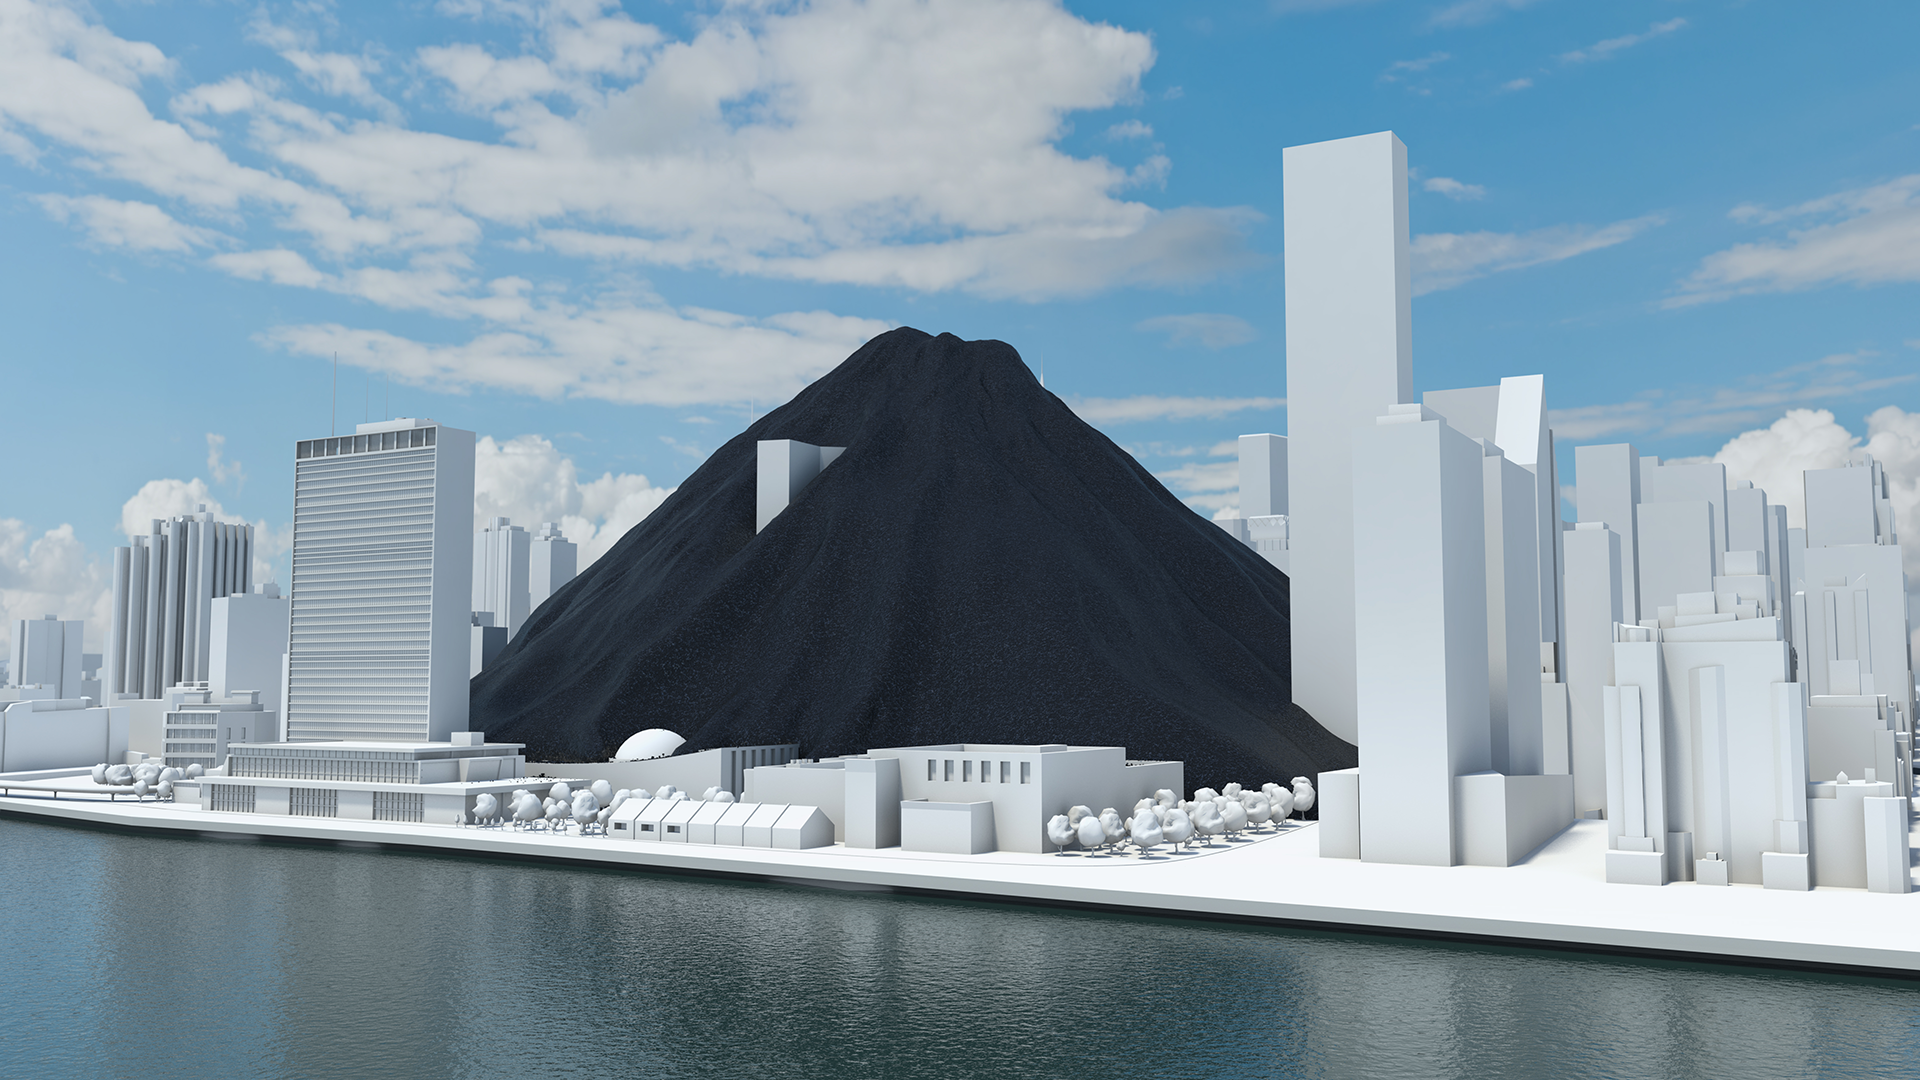
A coal pile buries the UN General Assembly, gas races down 42nd Street and then New York is lost under a blue mountain. These dramatic CGI scenes, depicting actual quantities, create an immersive journey that brings home the scale of global carbon emissions and fossil fuel consumption.
This dynamic four-minute film, being launched at the UN Climate Change Summit in New York September 2014, shows the part that carbon capture and storage can play in limiting global climate change to 2 degrees.
Commissioned by WBCSD and produced by Carbon Visuals, the animation is being shown to world leaders, industry experts, campaigners and scientists at the Summit to help catalyse and inform conversations about reducing carbon emissions.
Key messages of the film:
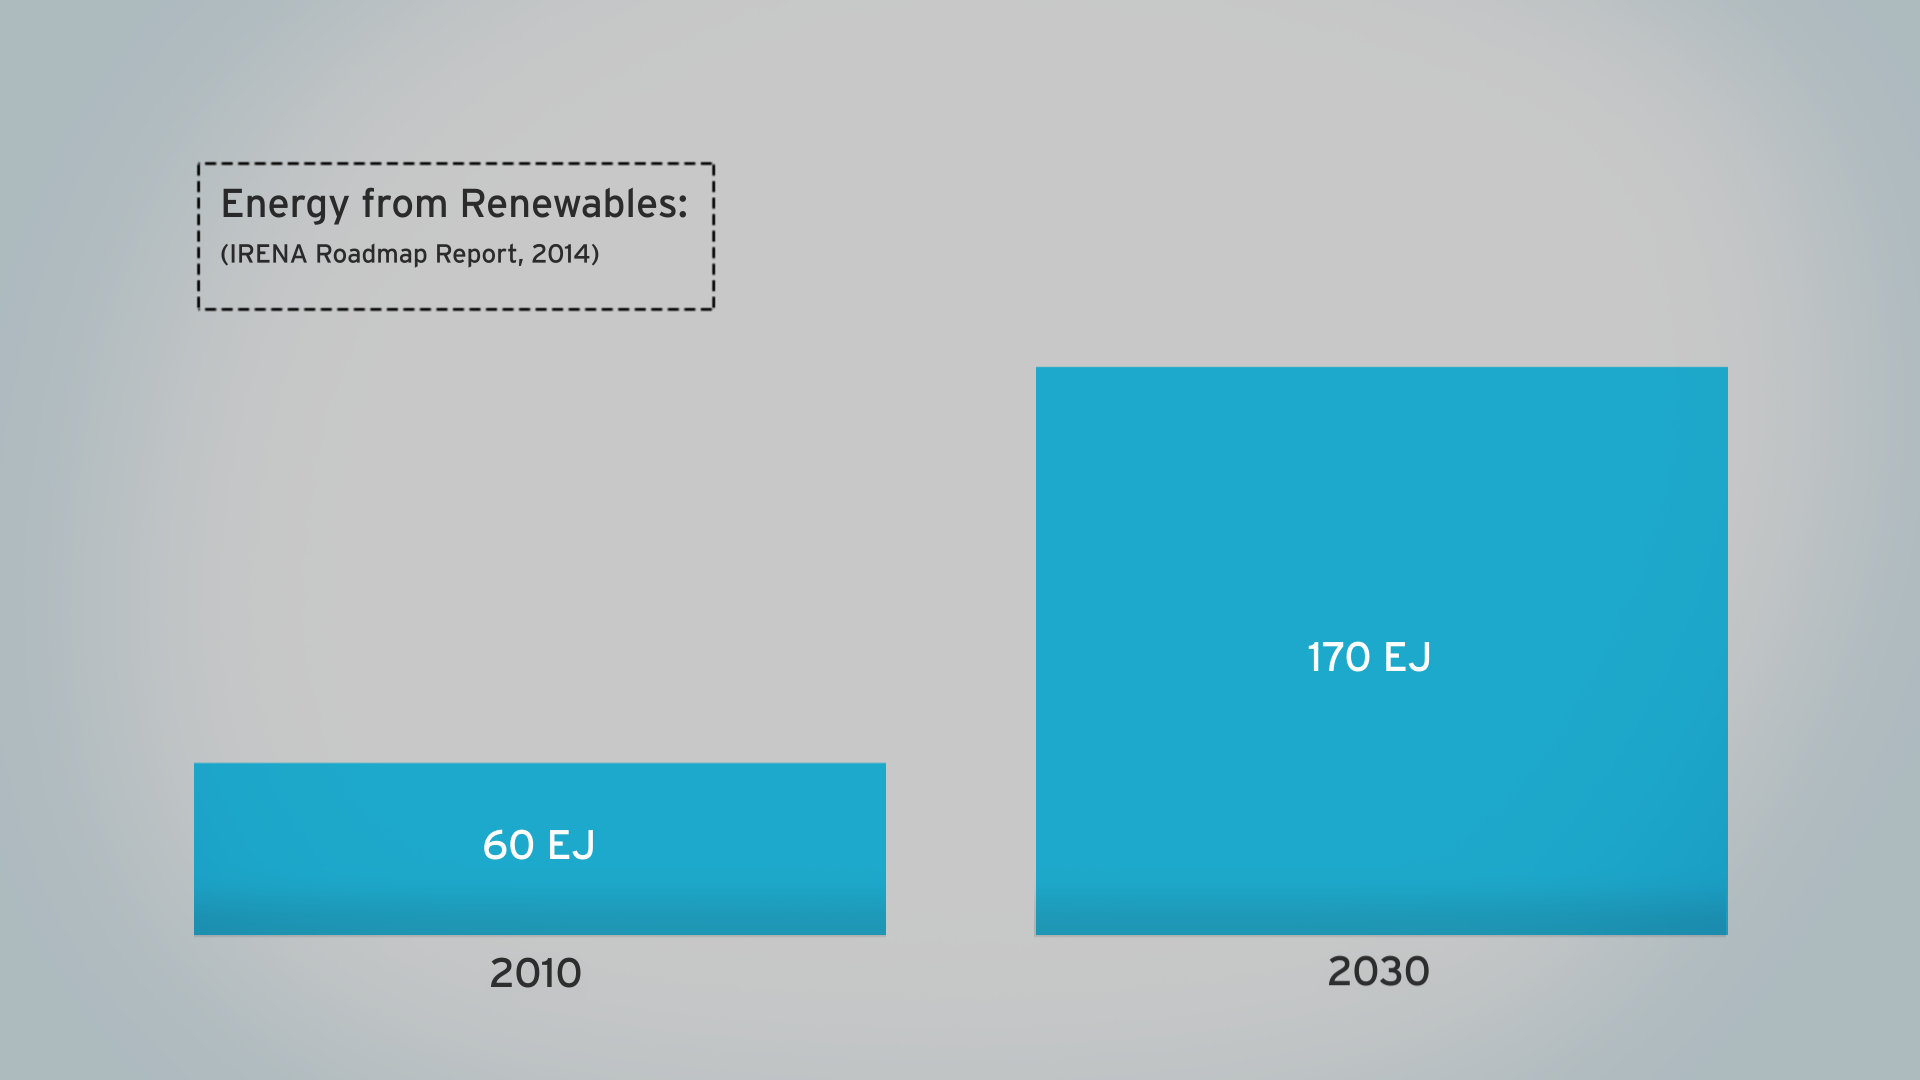
- use of renewables is increasing
- but energy use is rising faster
- fossil fuel use is increasing not decreasing
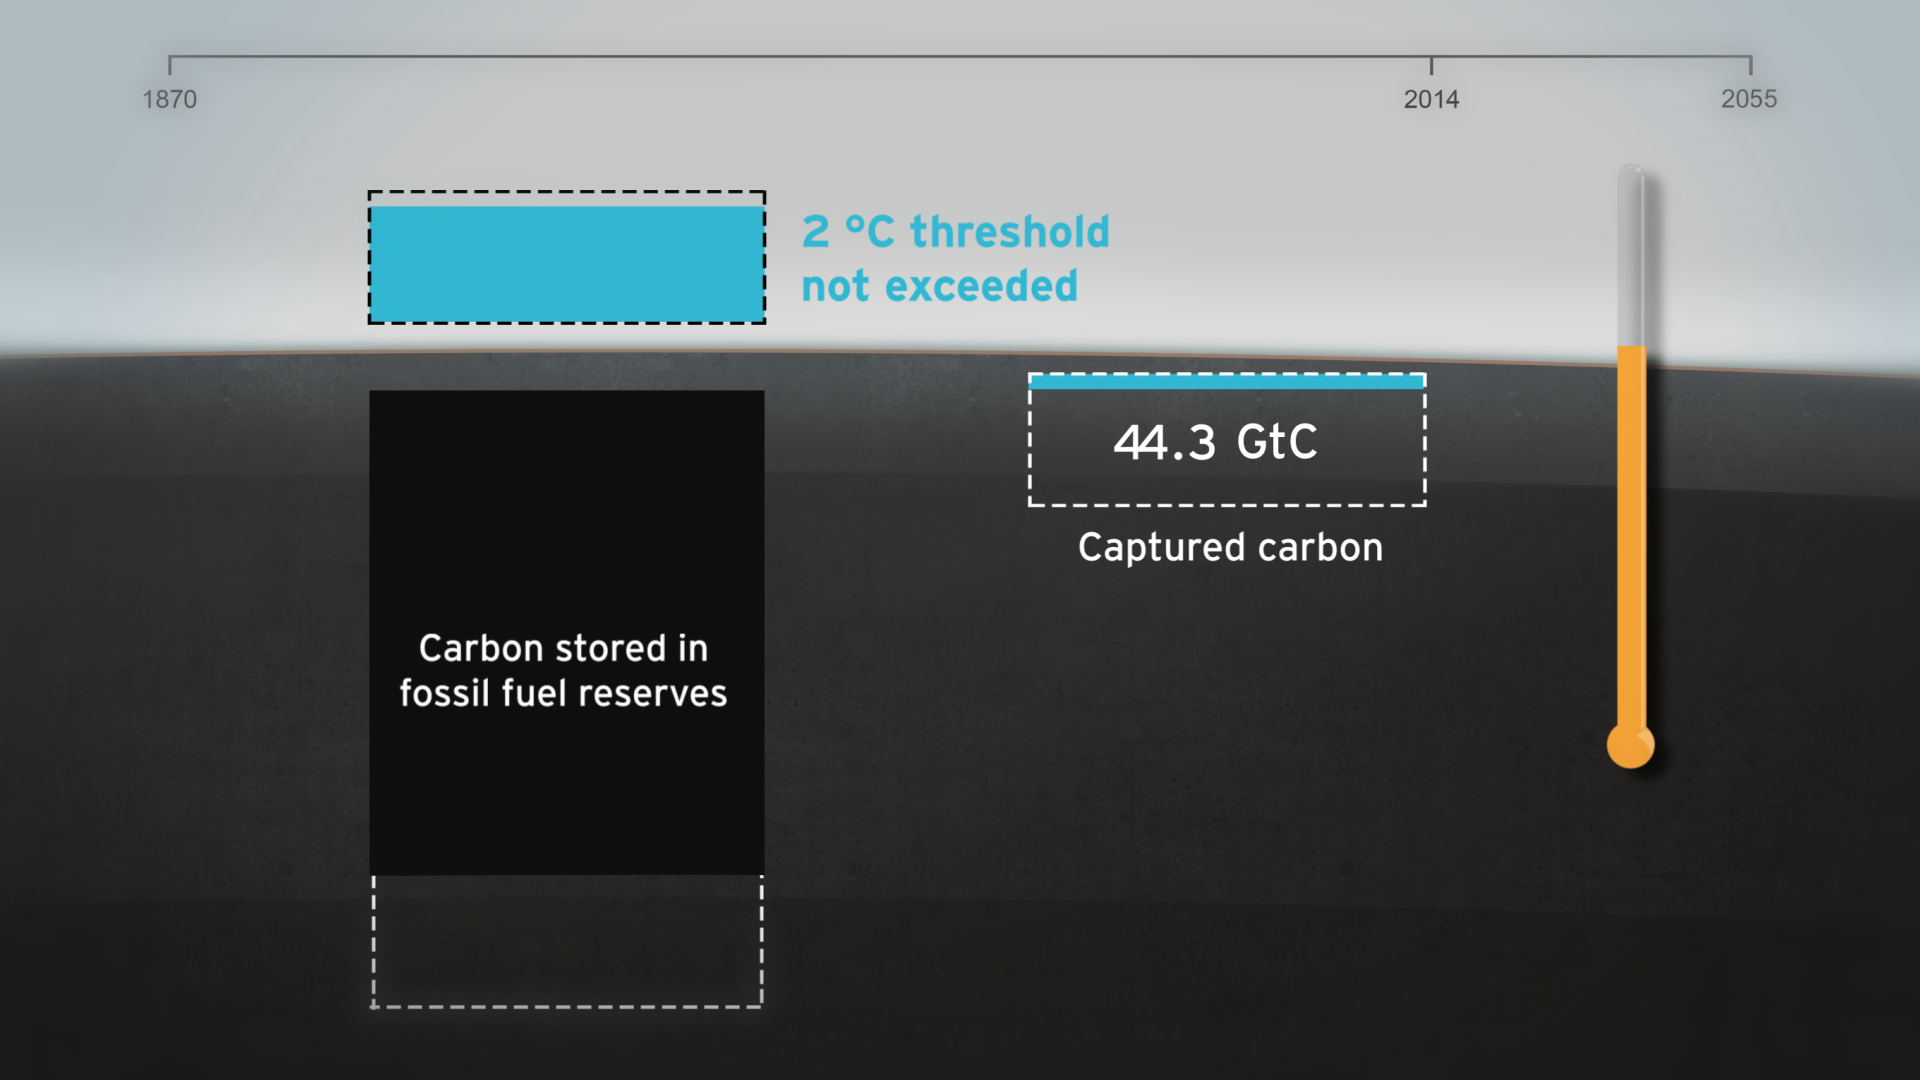
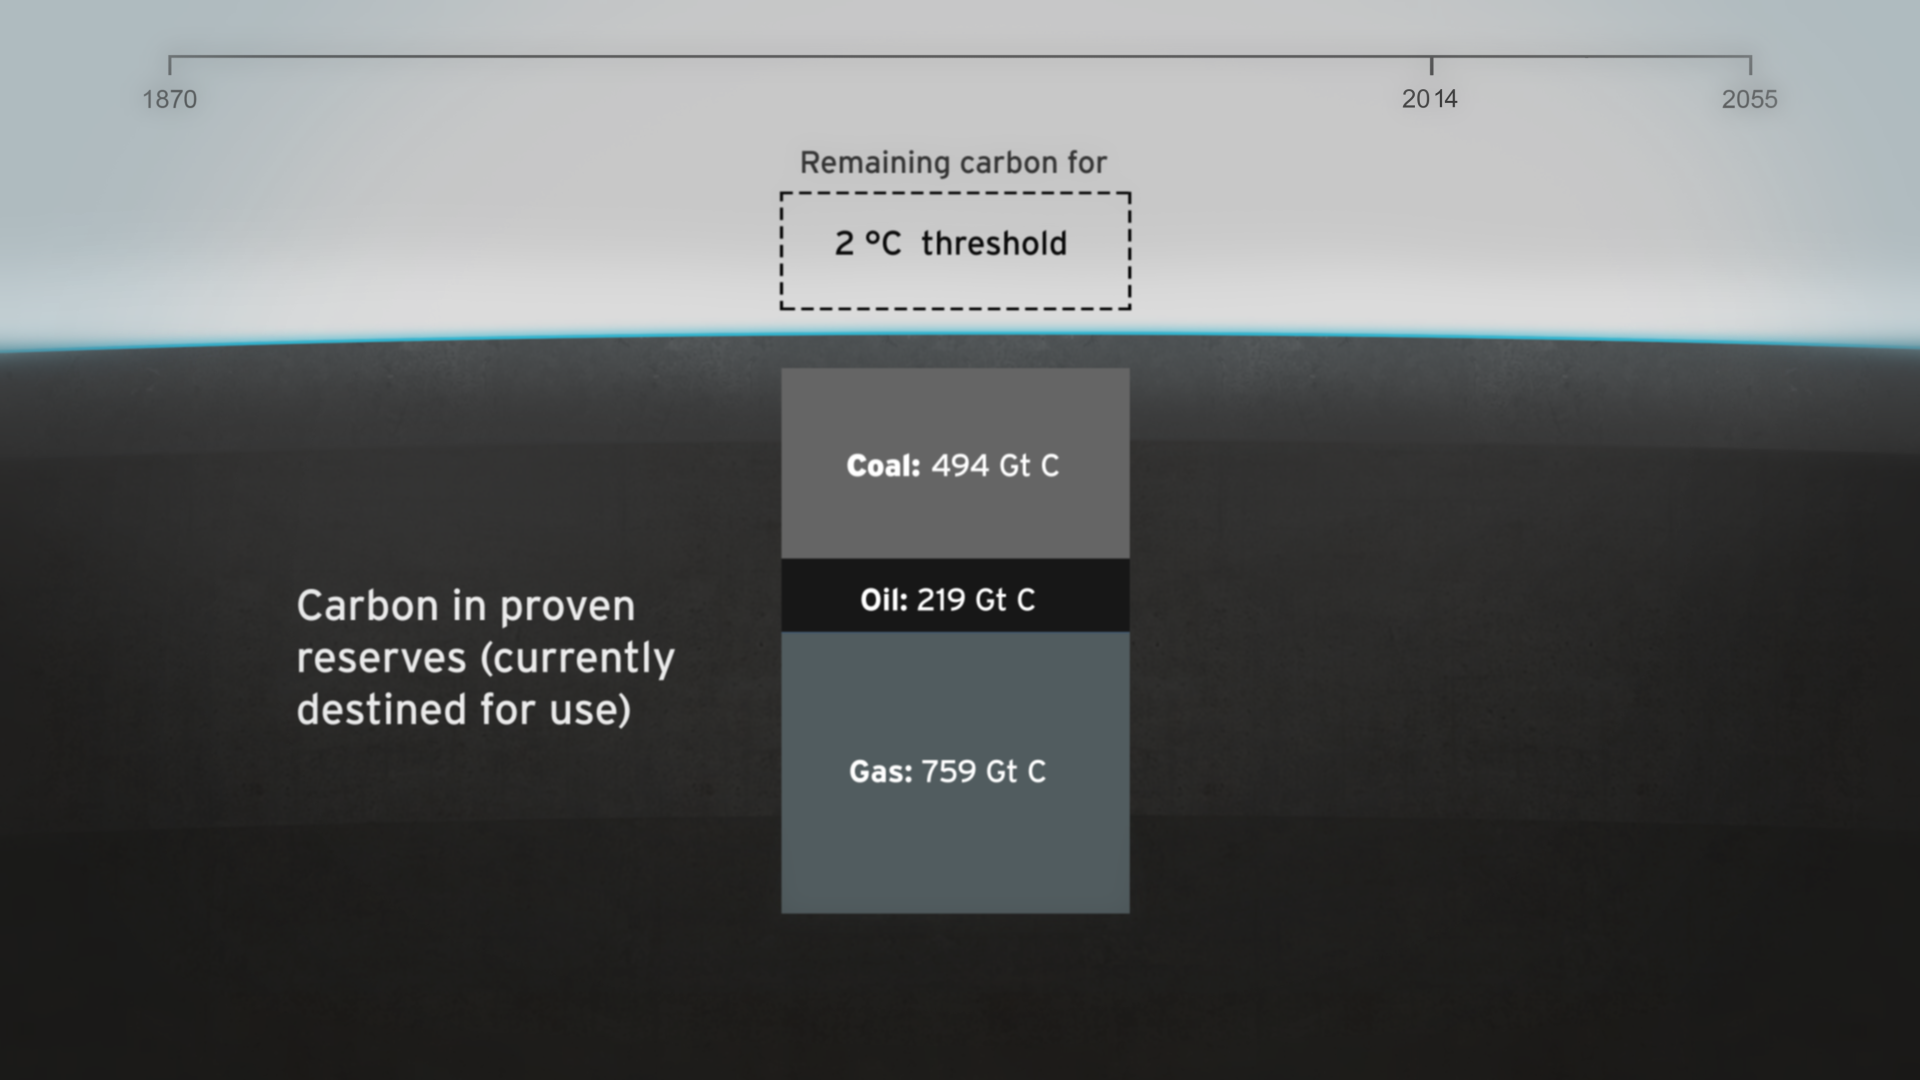
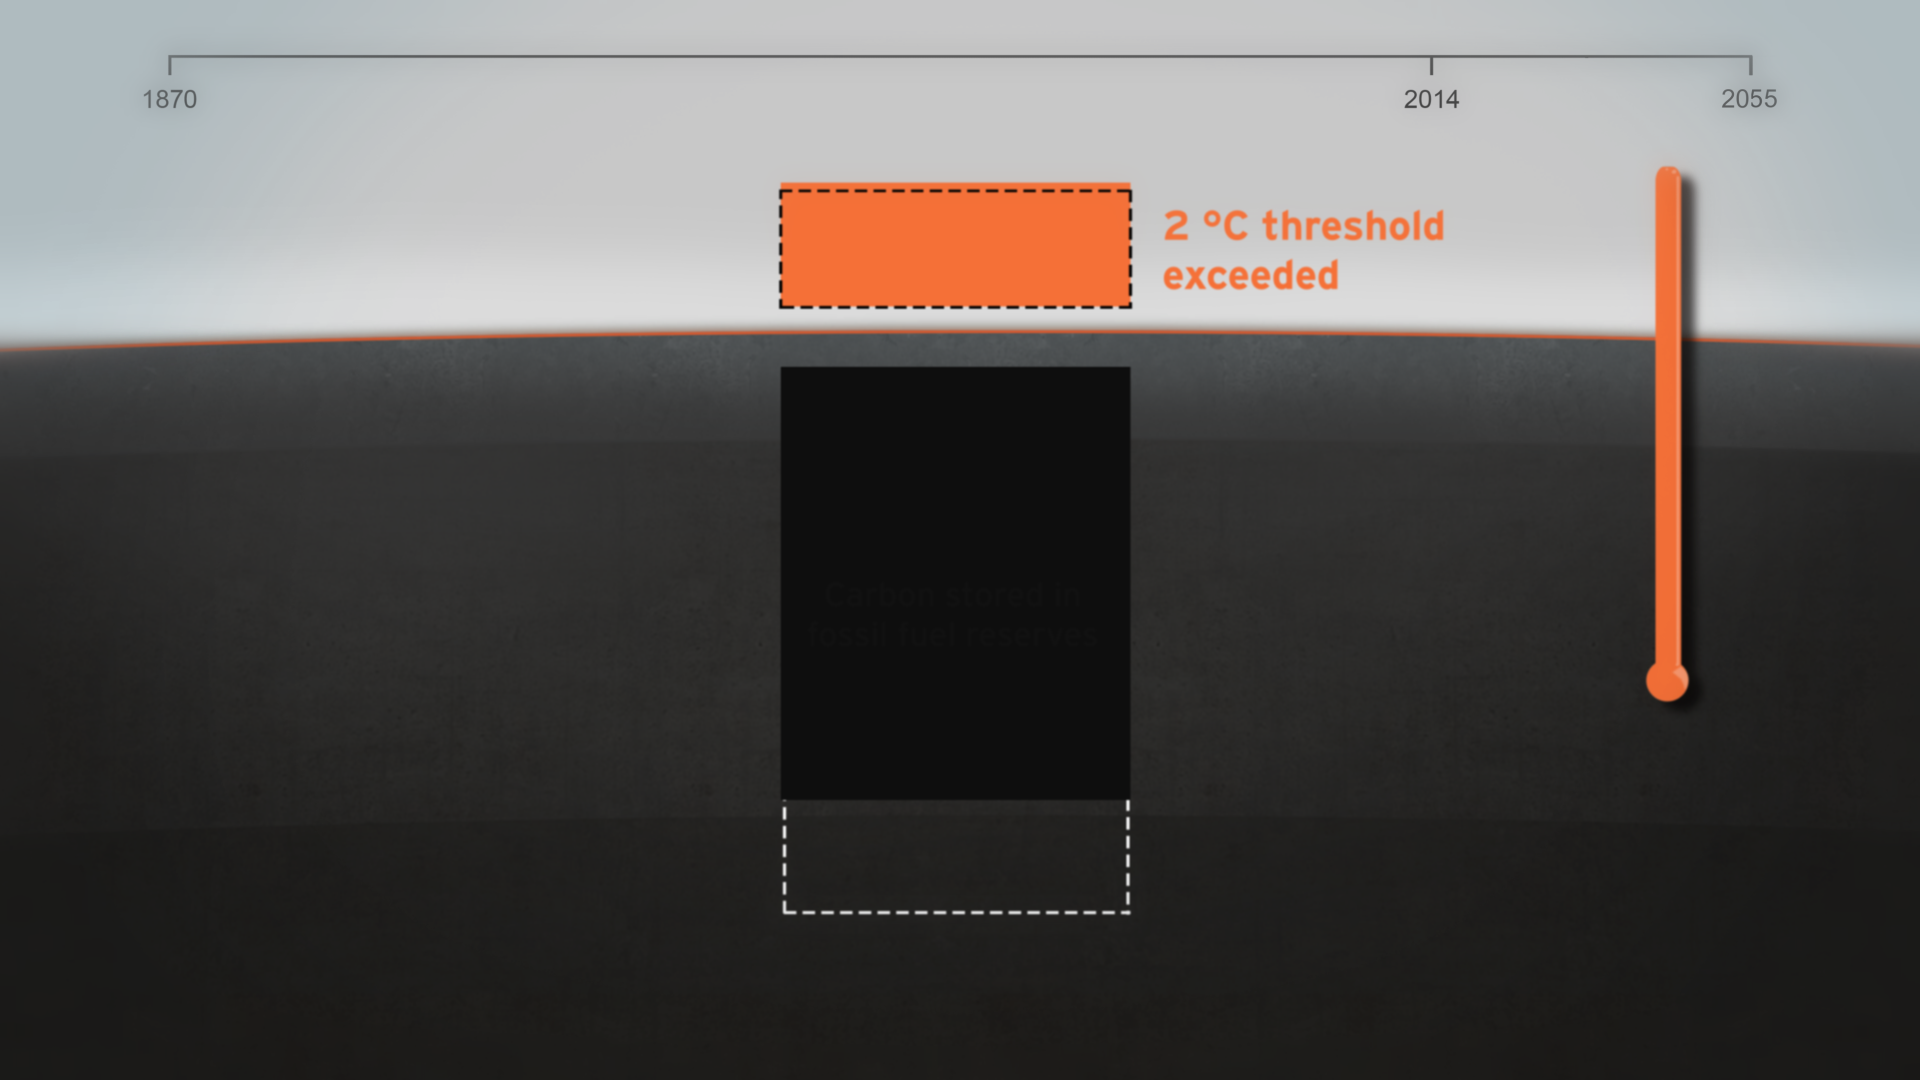
- if carbon stored in fossil fuel reserves is burnt we exceed 2 degrees warming by 2055
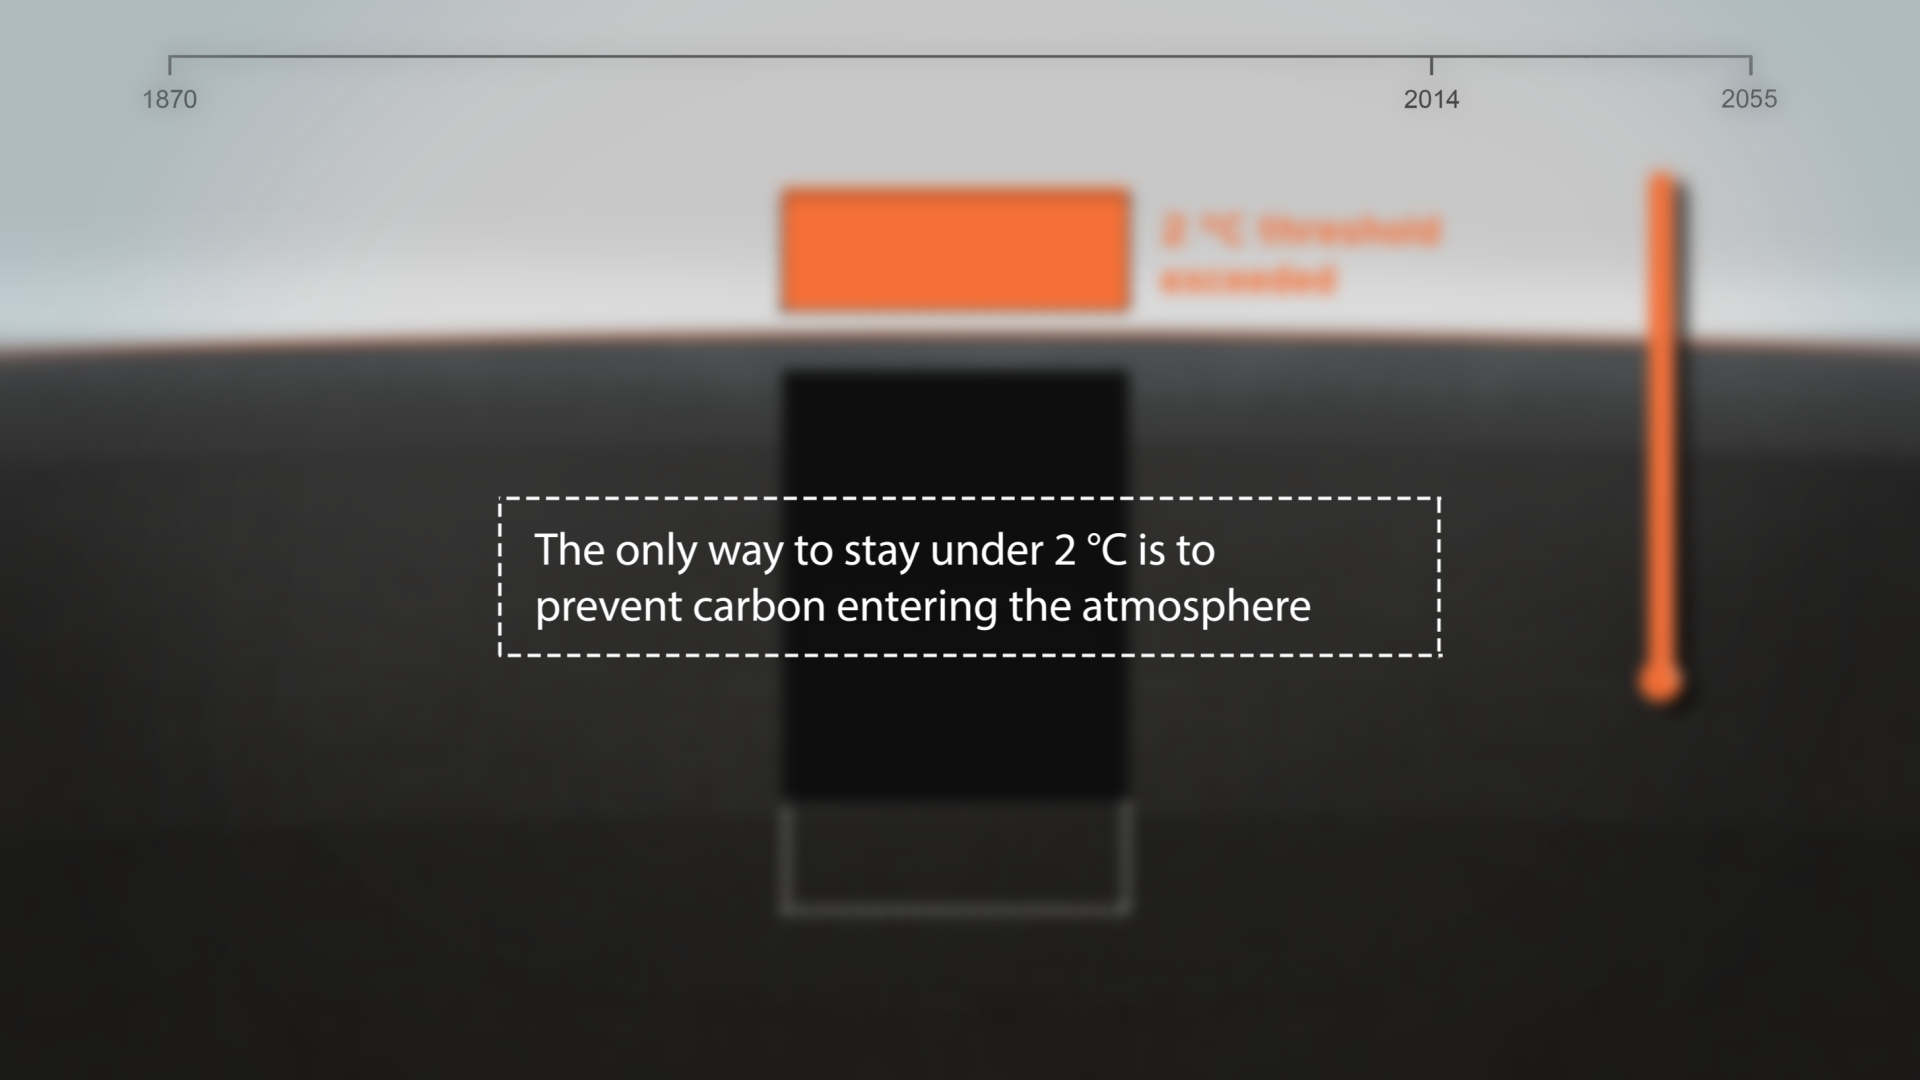
- carbon capture & storage (CCS) is an essential part of the 2 degrees solution
Technical note
The volumes of coal, oil, gas and CO2 shown in the film are accurate volumes based on best available data. A detailed Technical Data Methodology document has been produced to accompany the film. This shows all data sources, assumptions on future global renewable and non-renewable energy requirements and the potential of carbon capture and storage technology.
See the Methodology Document for more details
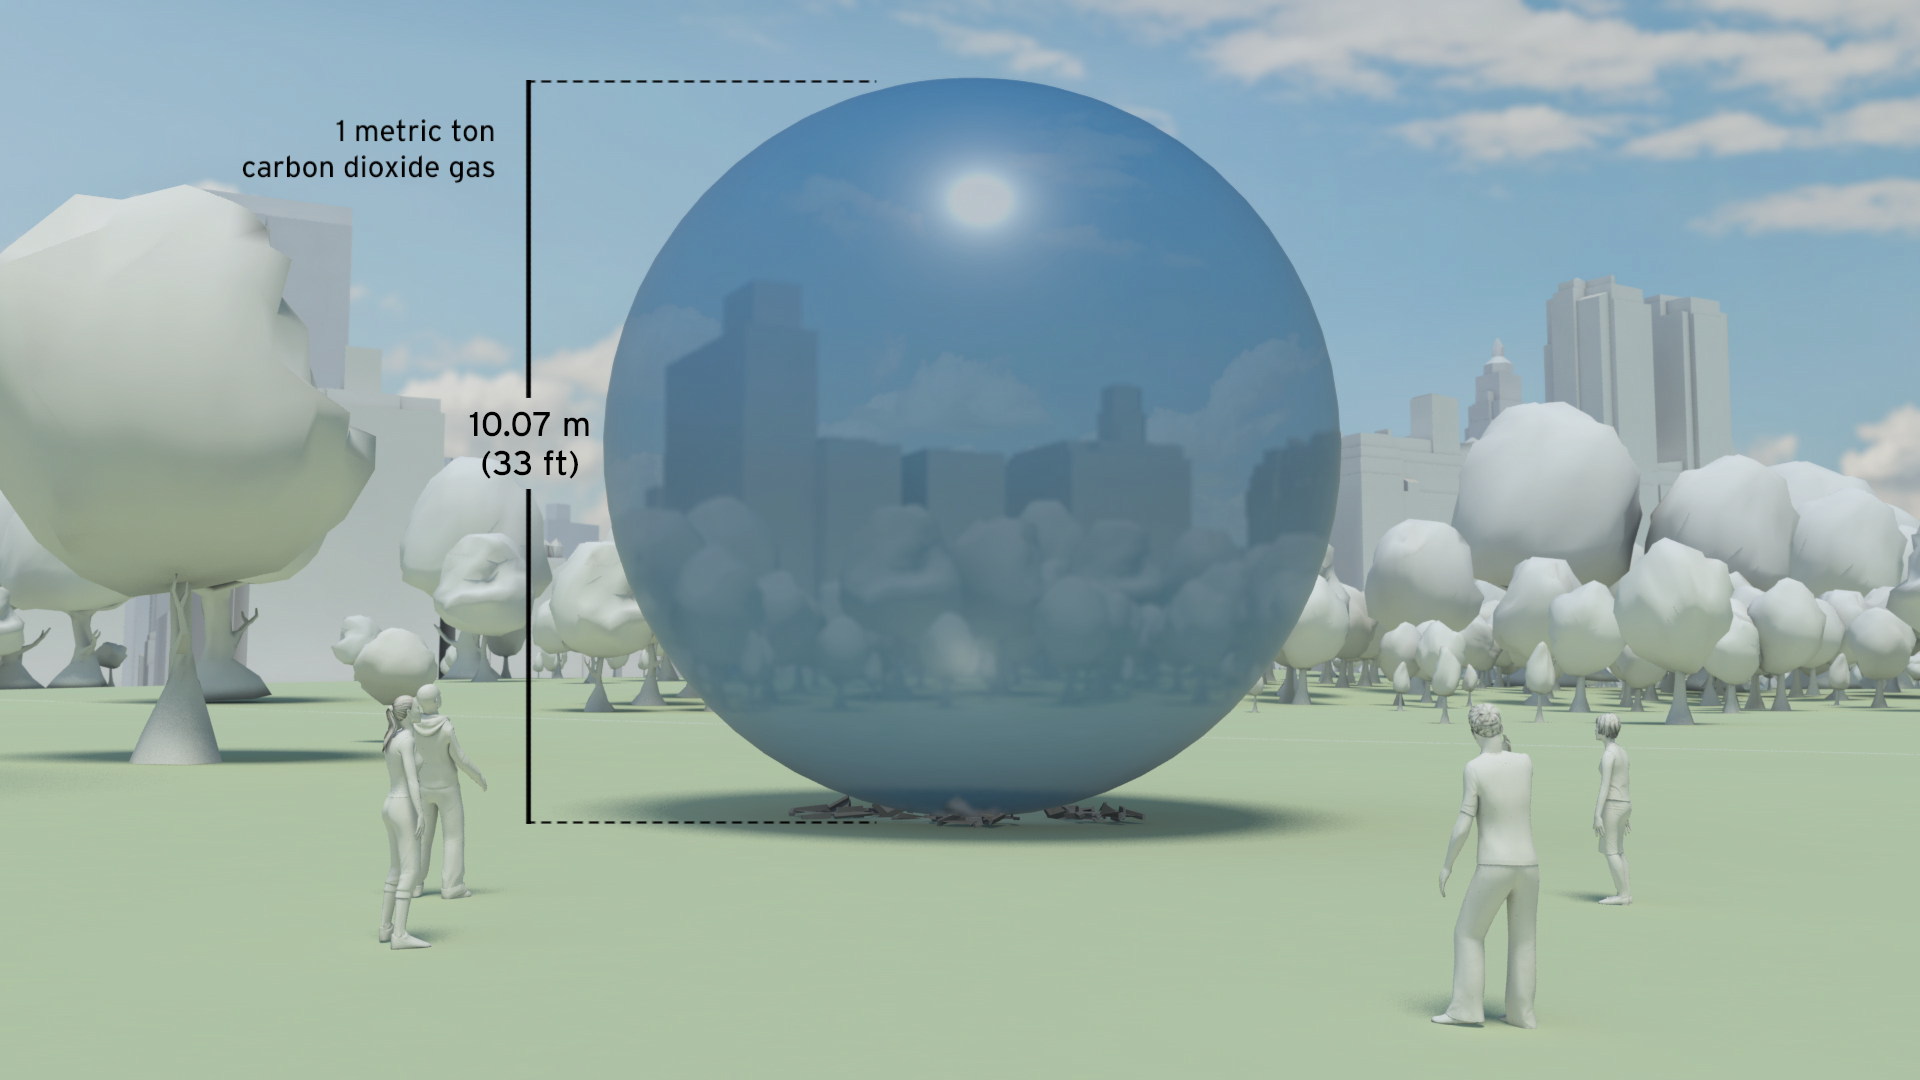
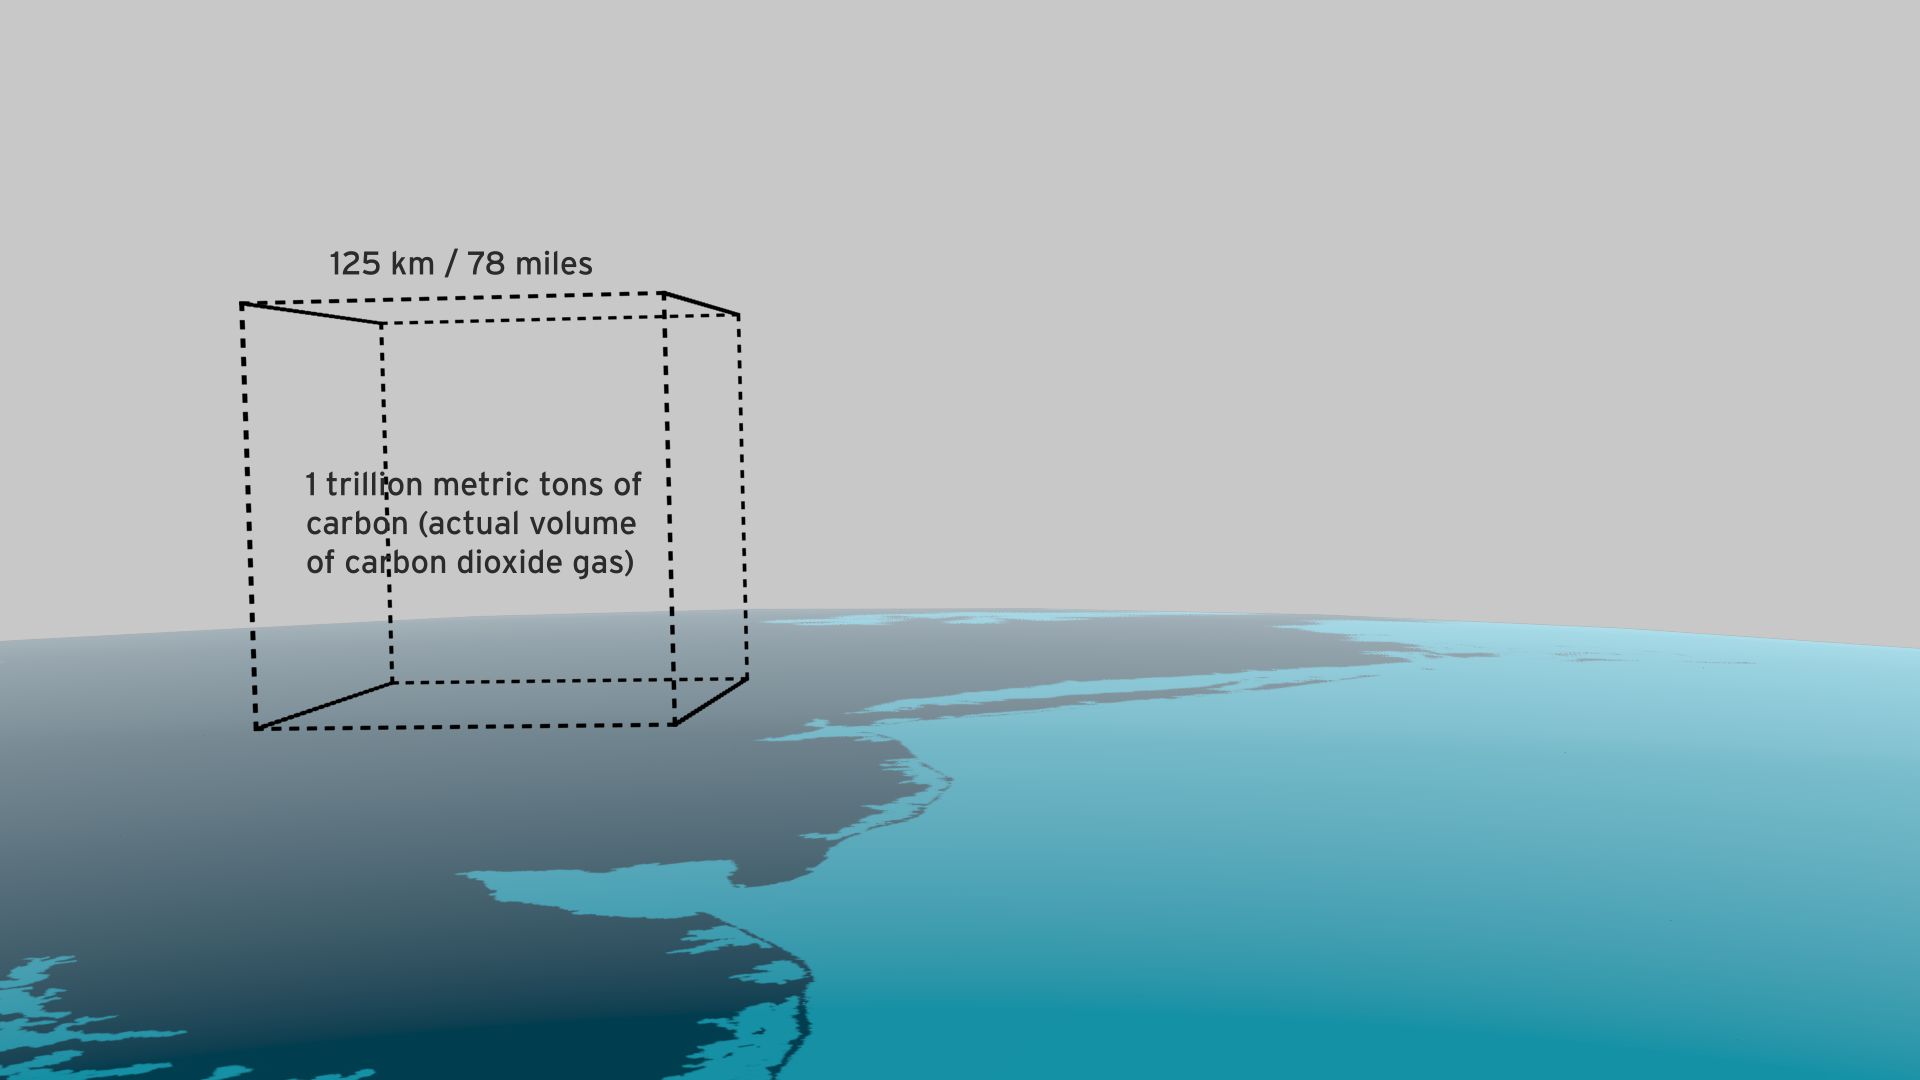
In 2012 we added over 39 billion metric tons of carbon dioxide to the atmosphere. That’s 1,237 metric tons a second.
It is like a ‘bubble’ of carbon dioxide gas 108 metres across entering the atmosphere every second of every day. We could fill a volume the size of the UN Secretariat Building with our carbon dioxide emissions in less than half a second. We could fill it 133 times a minute.
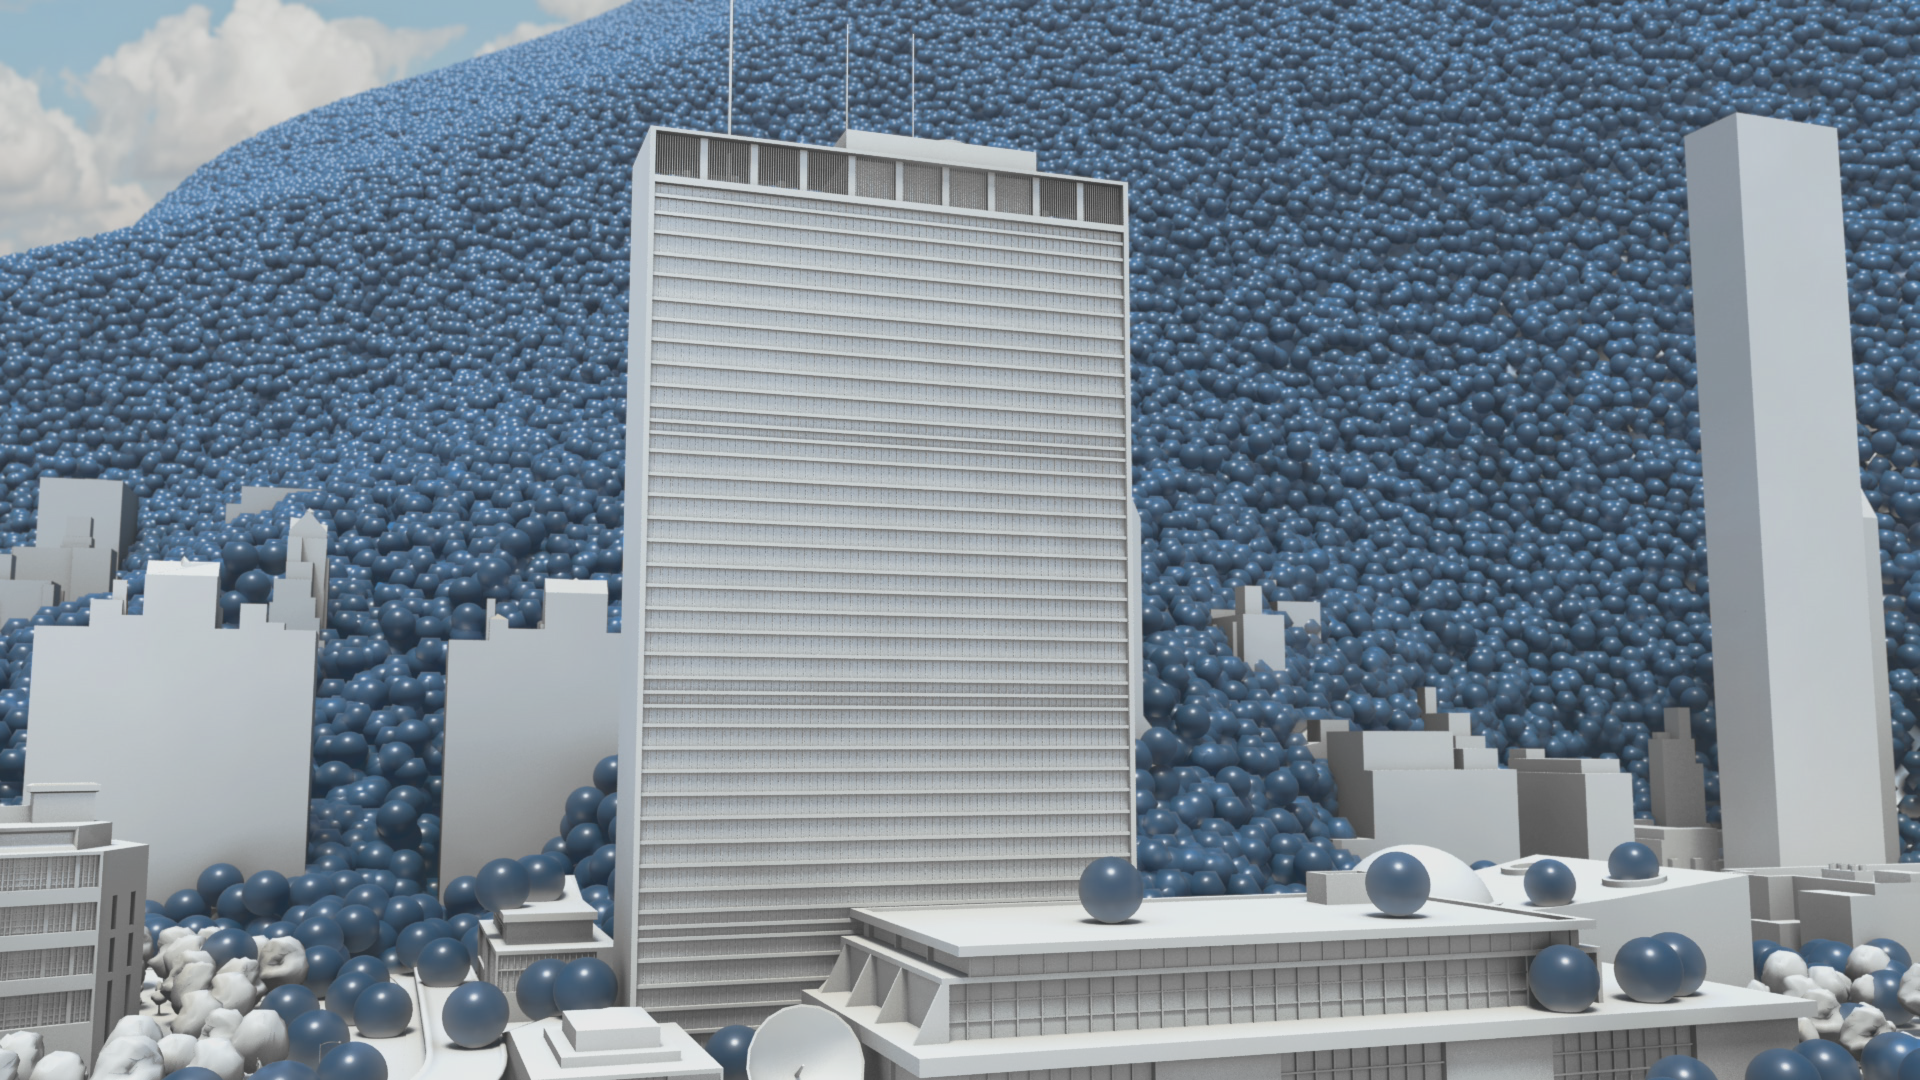
The pile of one metric ton spheres in the film, which represents one day’s emissions, is 3.7 km high (2.3 miles) and 7.4 km across (4.6 miles).
The world gets through a lot of fossil fuels:
7,896.4 million metric tons of coal a year (21.6 million metric tons per day, 250 metric tons per second)
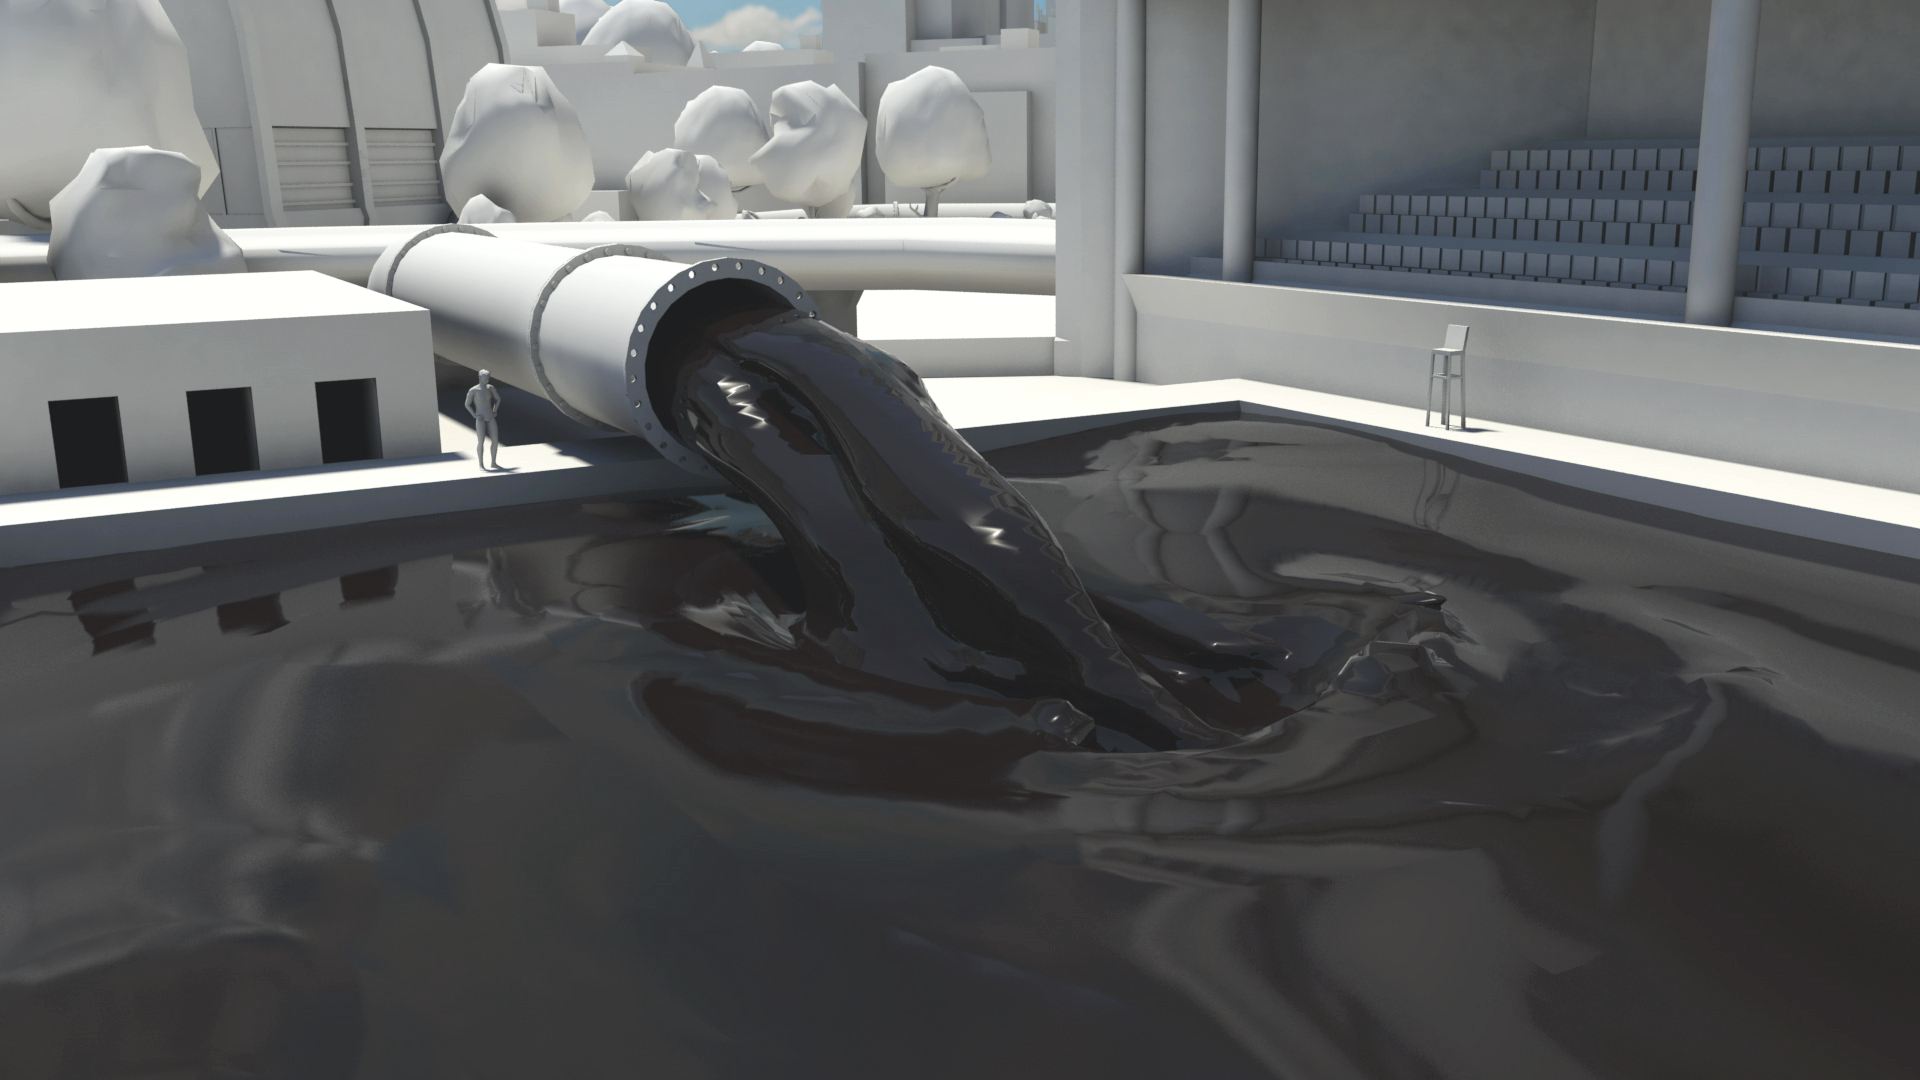
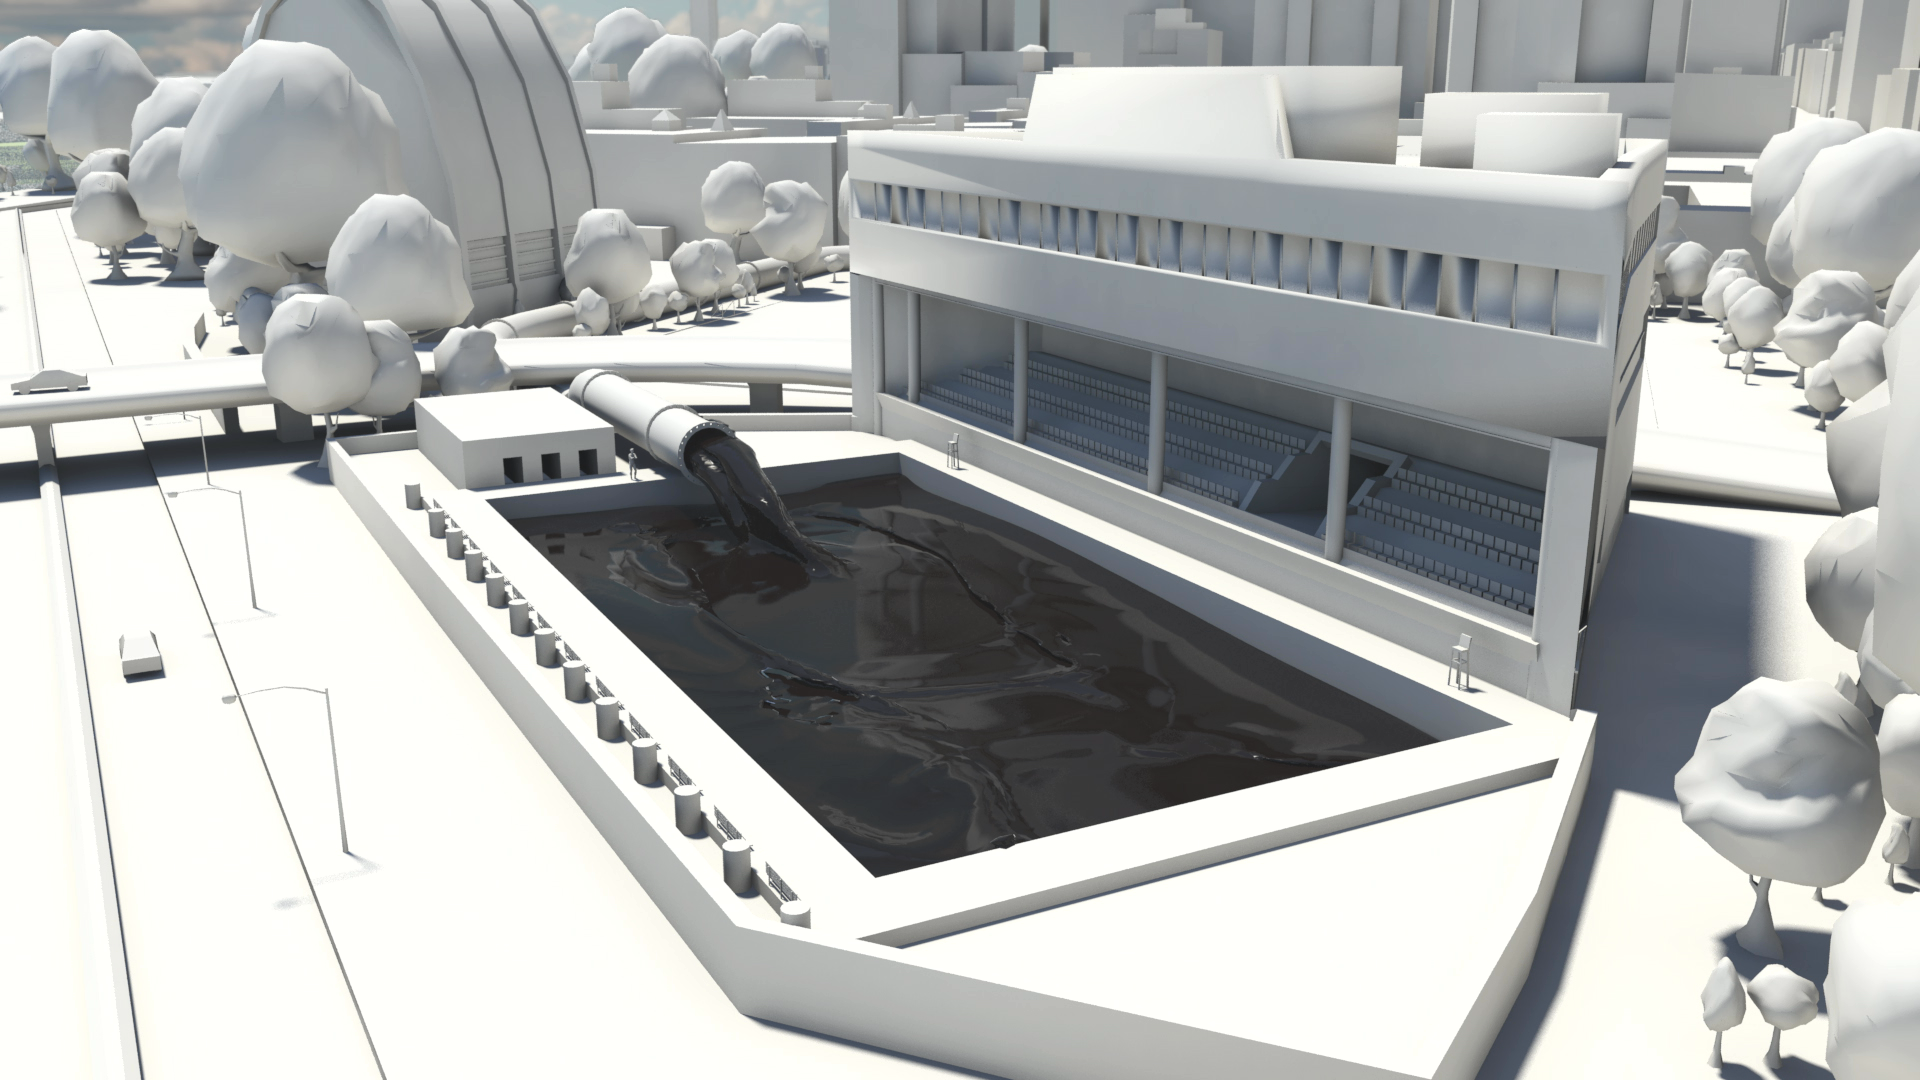
91,330,895 barrels of oil per day (168 m3 per second)
3,347.63 billion m3 of natural gas per year (9.2 km3 per day, 106,082 m3 per second)
This film tries to make those numbers physically meaningful – to make the quantities real; more than ‘just numbers’.
The coal we use each day would form a pile 192 metres high and 546 metres across. We could fill a volume the size of the UN Secretariat Building with coal every 17 minutes. At the rate we use oil, we could fill an Olympic swimming pool every 15 seconds.
This would fill a volume the size of the UN Secretariat Building with oil every 30 minutes.
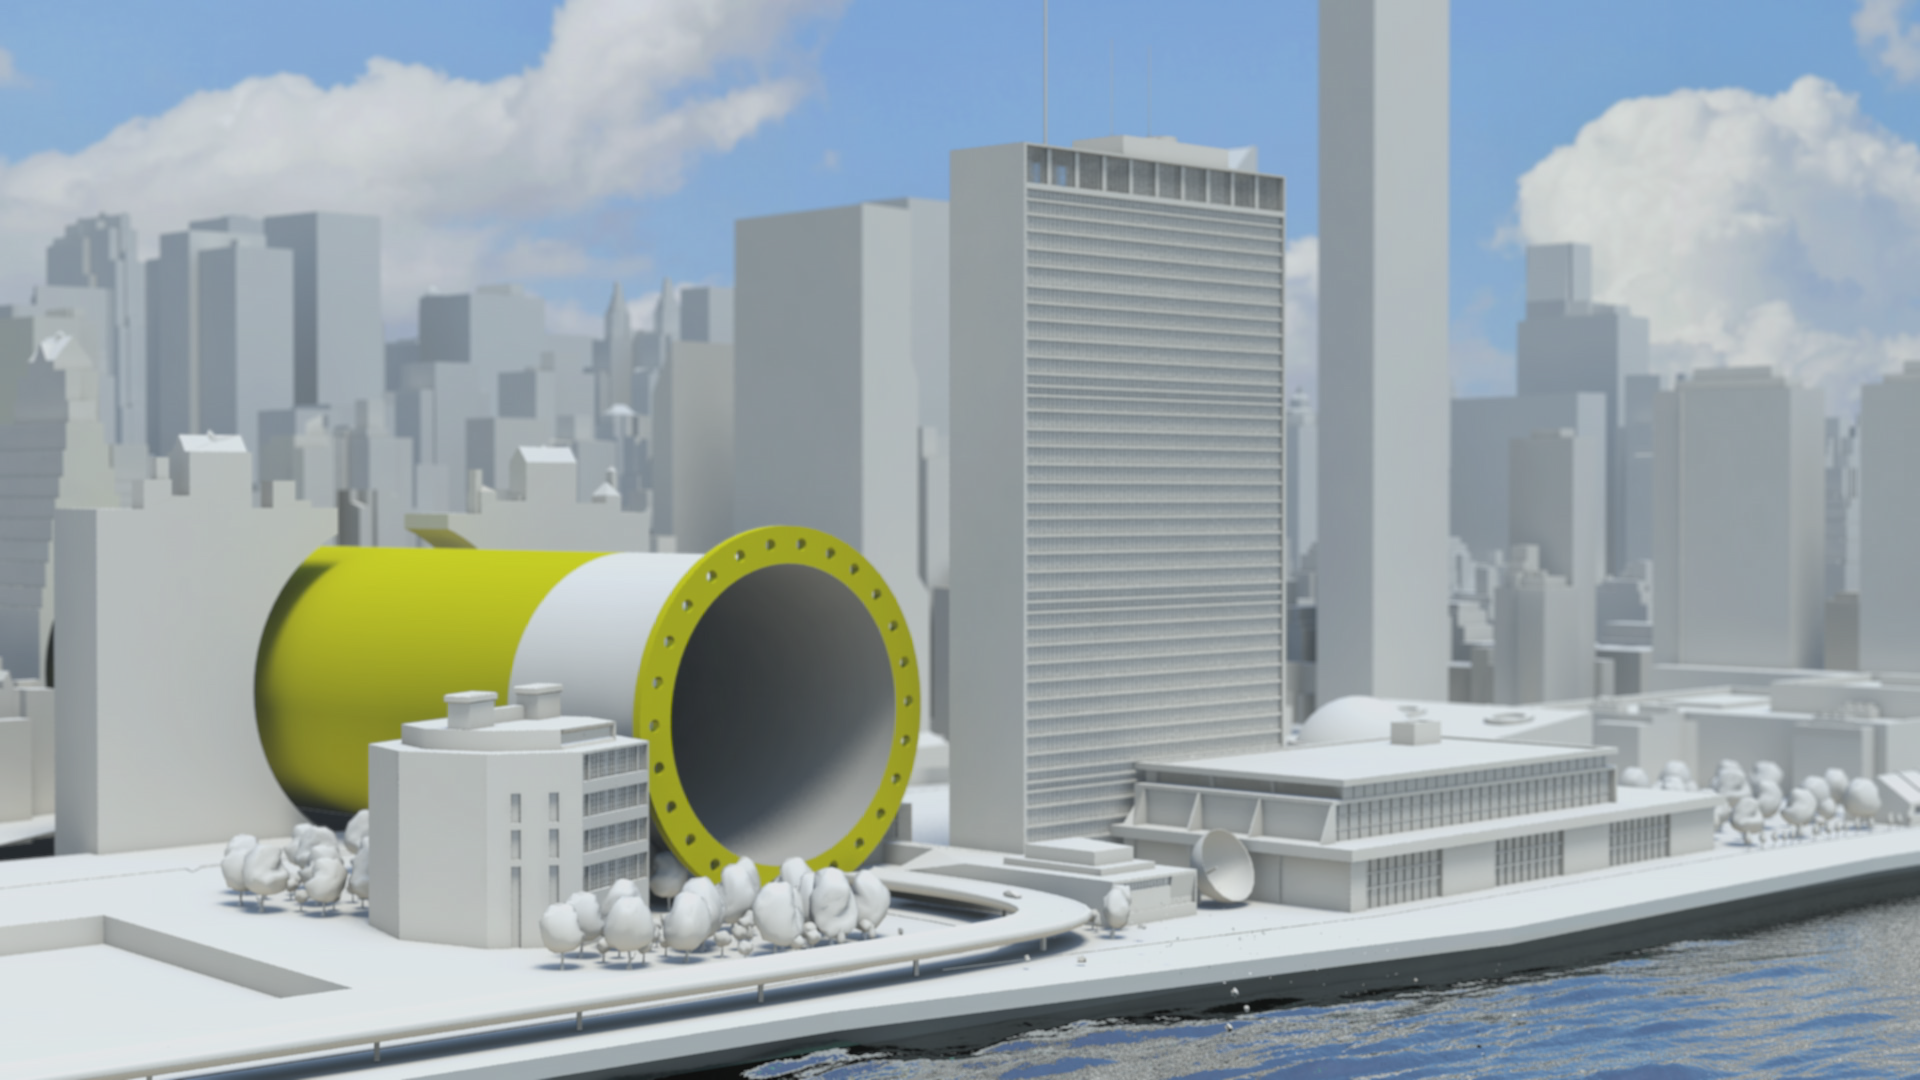
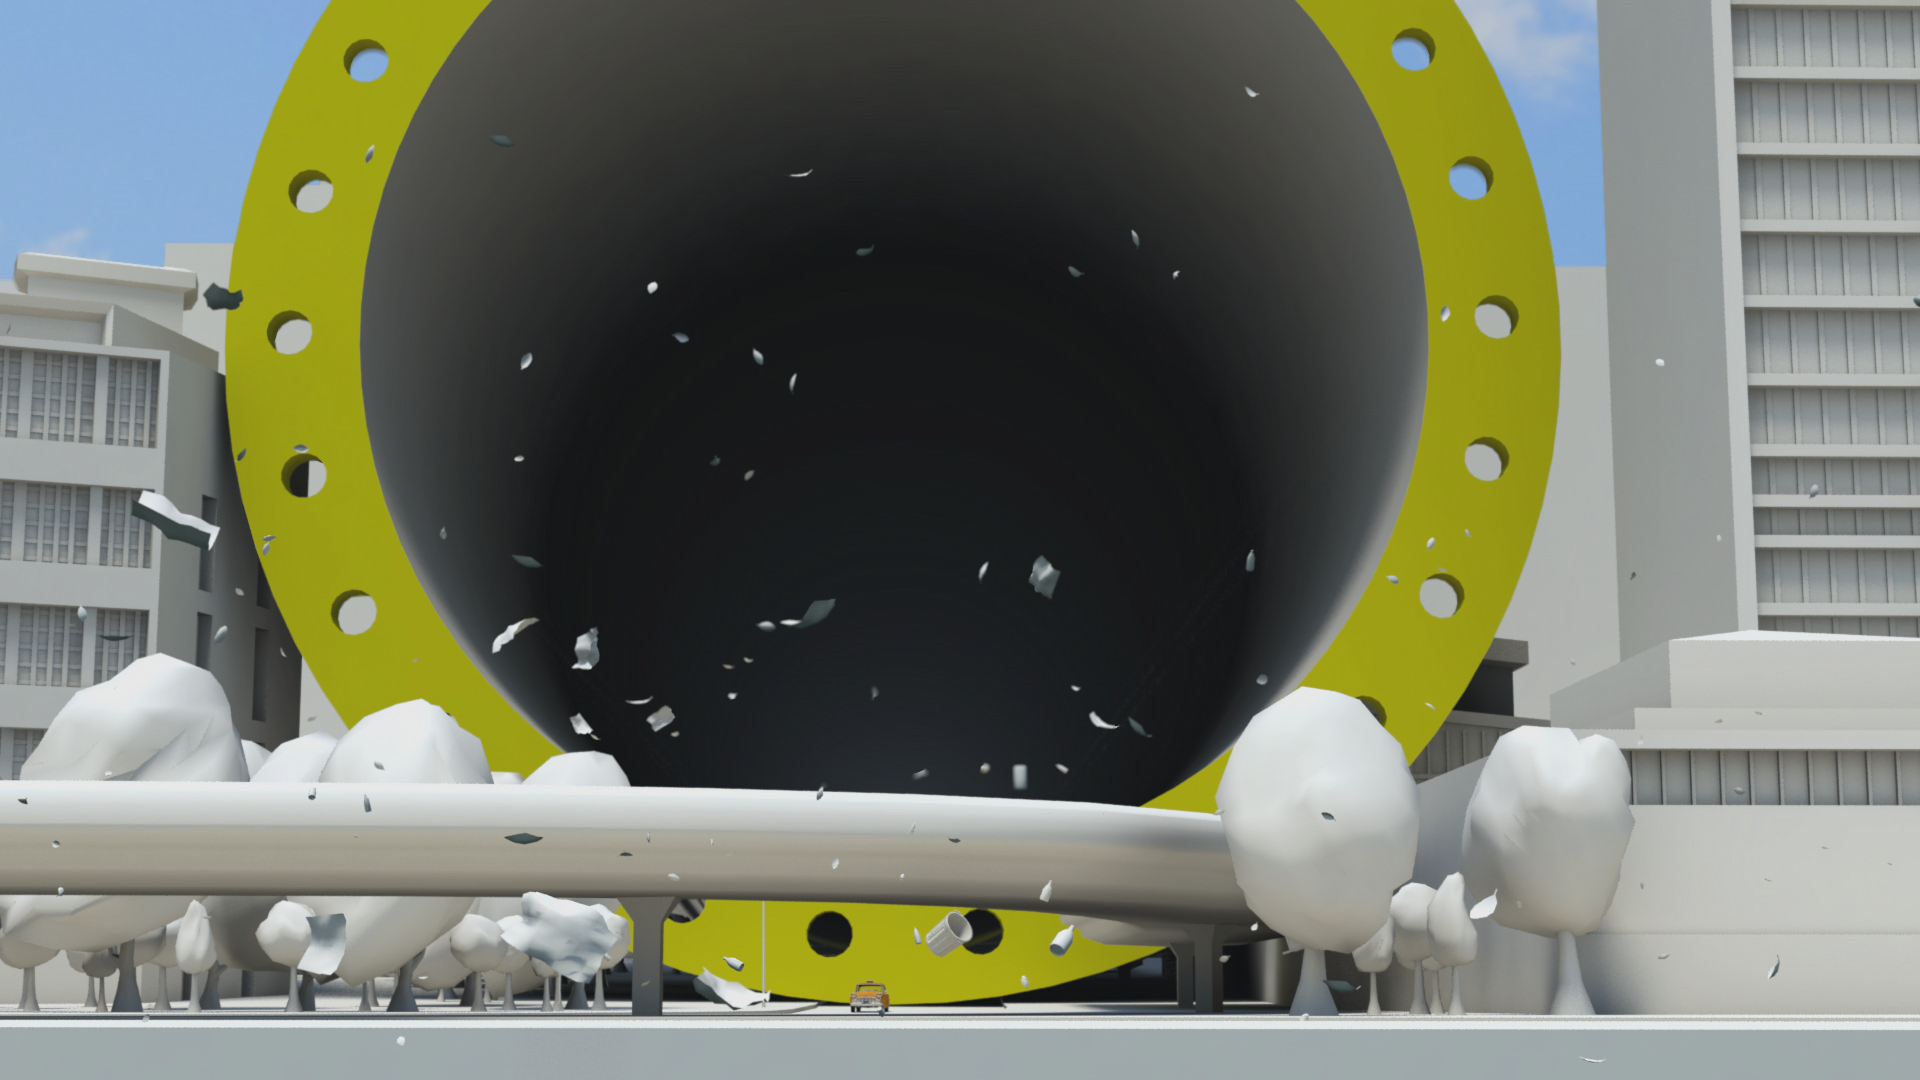
The rate at which we use natural gas is equivalent to gas travelling along a pipe with an internal diameter of 60 metres at hurricane speeds (135 km/h / 84 mph). We could fill a volume the size of the UN Secretariat Building with natural gas in under 3 seconds.
We use a cubic kilometre of gas every 2 hours 37 minutes and a cubic mile of the stuff every 10 hours 54 minutes.
A set of shorter clips has also been released, featuring some of the most impactful scenes of the main film. These are intended for use by everyone, from industry through to educators and campaigners. Get in touch if you would like hi-res versions.
Main film and extract films can be viewed on YouTube:
All images are available under Creative Commons licence to download on our Flickr page

