CLIENT
United Nations Environment Programme
PURPOSE
To convey the scale and complexity of resource use in the Asia Pacific region at a conference of Environment Ministers and subsequently to other audiences.
DESCRIPTION
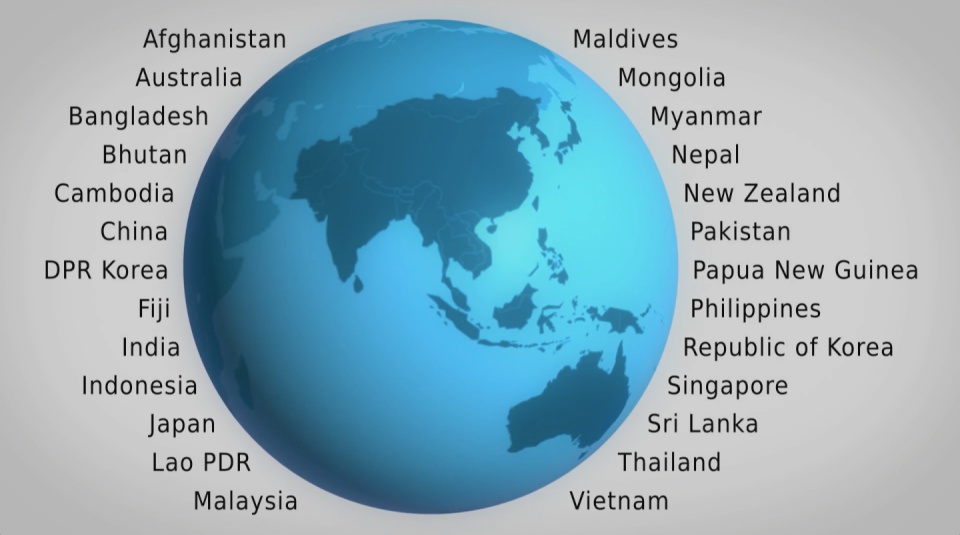
A high impact video and interactive web-tools to introduce and enable easy exploration of a database covering 26 Asia Pacific countries, 157 indicators and 40 years.
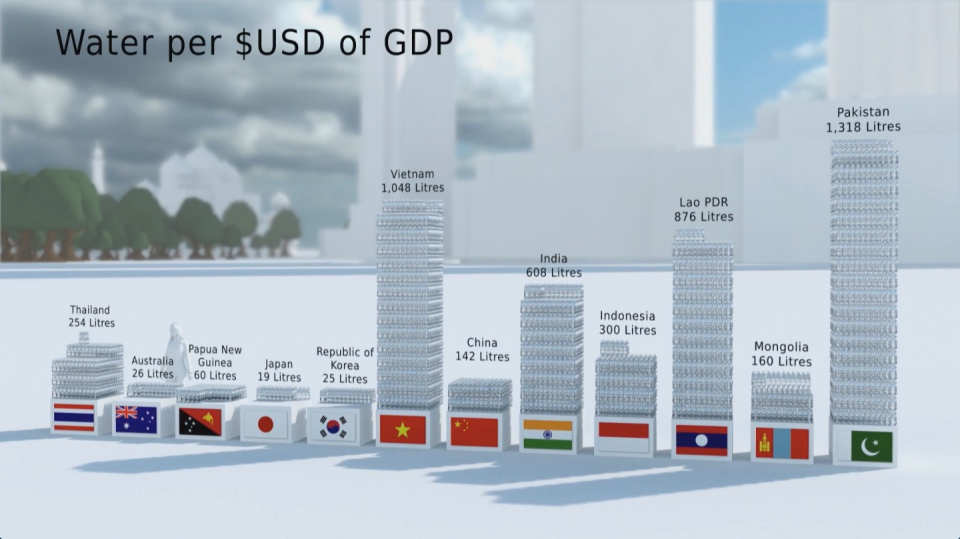
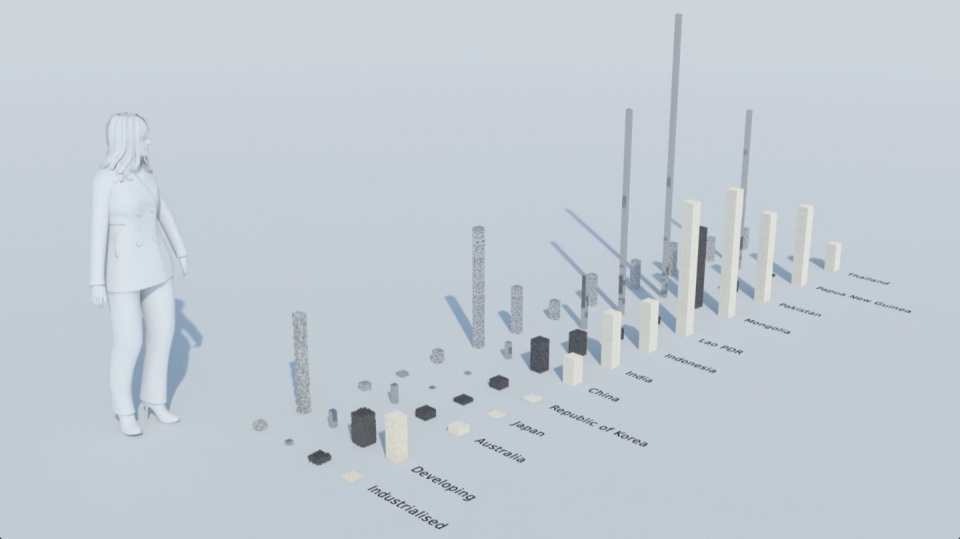
How much natural resources are used to earn one dollar in developing countries in the Asia Pacific region? How do you effectively show water, metal and biomass usage rates across 26 Asian countries - and make it personal and real? What is the best way to visualise a range of environmental resource indicators ‘per GDP’ across countries?
These were some of the challenges set for us by the United Nations Environment Programme (UNEP) in a project undertaken in conjunction with our not-for-profit partner CarbonSense Foundation.
This video has taken our communications to a higher level, and improved our ability to cut across a crowded policy landscape to really help decision makers reflect on resource efficiency.
Janet Salem, UNEP, Bangkok
The brief from the UNEP Bangkok office was to design and create a short, high impact video to convey the scale and complexity of resource use in the Asia Pacific region. In addition a set of interactive web-tools is being provided to complement the film and allow easy exploration of the data.
The film is supporting a database of resource efficiency data covering 26 Asia Pacific countries, 157 indicators and 40 years (1970-2010). The indicators are designed to inform policy development in the region based on the principles of circular economy, sustainable consumption and production principles.*
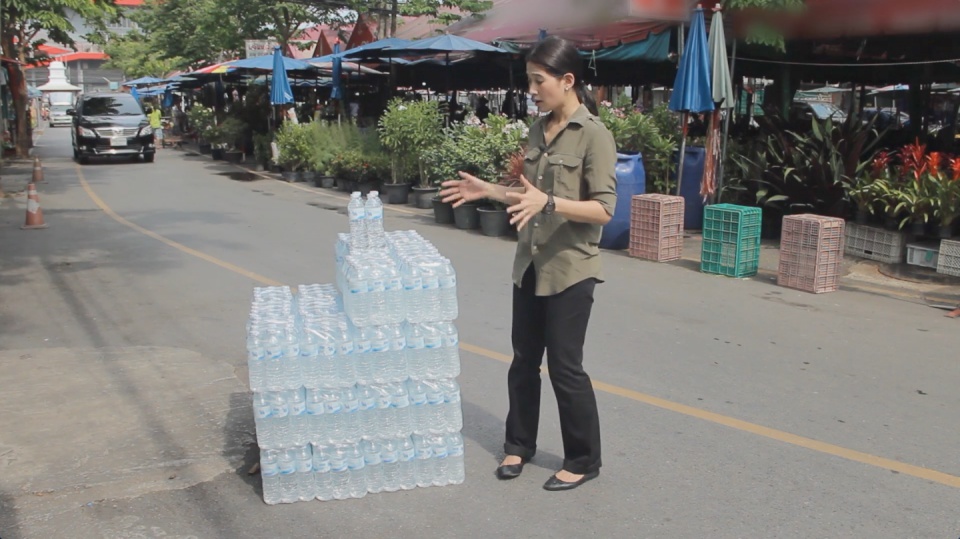
Resource efficiency is crucial for sustainability but how do you make it real and meaningful at a national and a personal level? To bring such a huge subject up front and personal, we combined live action film introducing very real piles of materials on a table-top with national and regional resource use and impacts made tangible with CGI graphics. And uniquely this project allowed us to explore ways that our creative techniques could be combined with economic data.
Because of the complexity of data and fast-track time schedule the project was carried out in a highly collaborative way, with UNEP staff in Bangkok supporting our creative team throughout the scoping, design and production phases.
The film was used to launch the UNEP Report at a conference on 19th May 2015 attended by Achim Steiner, Executive Director of UNEP, and Environment Ministers and policy makers from the Asia Pacific region.
See the UNEP webpage on project here
Finally - a very special thanks to Janet Salem of UNEP, Bangkok and our film presenter / narrator Patchari Raksawong.
*The database has been developed as a result of a three-year science-based consultative process mandated by countries in the region and coordinated by UNEP, the CSIRO and the Asia-Pacific Roundtable on Sustainable Consumption and Production (APRSCP), with support from the European Union's SWITCH-Asia Programme.
An important part of this project was the creation of an interactive web-tool (see above) allowing policymakers to explore the database in detail in an intuitive way. We created a 'heat map' that allows comparison between a wide range of economic indicators for different countries. Mousing over the countries reveals the actual data.
Carbon Visuals has shown us different techniques to visualize data in a way that can resonate on a meaningful human level, while still giving us creative space for collaboration. We had a lot of fun with the team and it's been a really wonderful partnership.
Janet Salem, UNEP, Bangkok

