
CLIENT
BP
PURPOSE
To encourage motorists reduce emissions from driving.
DESCRIPTION
Consultancy and visuals for a web calculator showing actual volumes of CO2 which change in size as reduction actions are chosen, with image set and methodology.
Carbon Visuals helped newly re-launched BP Target Neutral project by providing consultancy for the web calculator designed to help motorists reduce, replace and offset carbon dioxide from driving. The calculator, aimed at the general public, is the first in the world to show actual volumes of CO2 which change in size as different reduction actions are chosen. In addition carbon spheres can be compared against averages for other countries as well as the UK 'target' reduction for 2050.
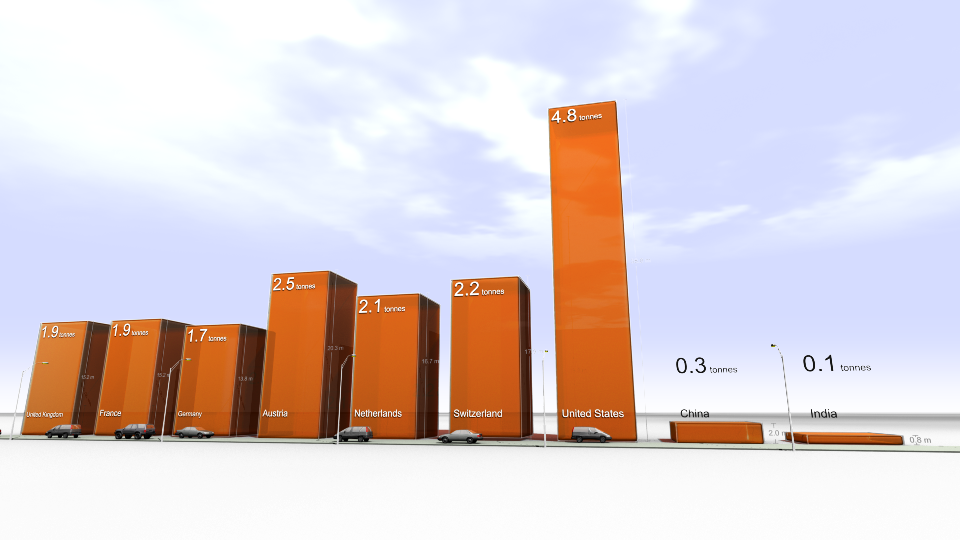
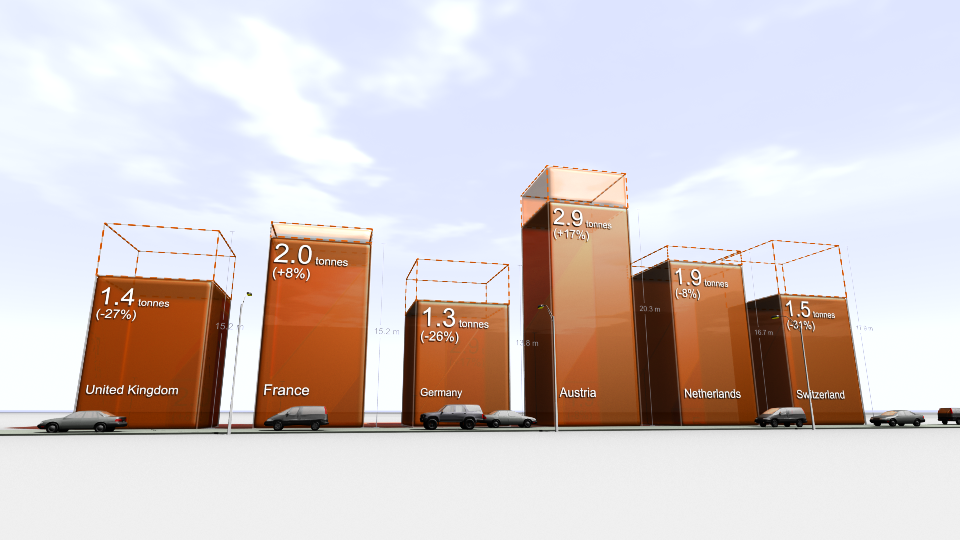
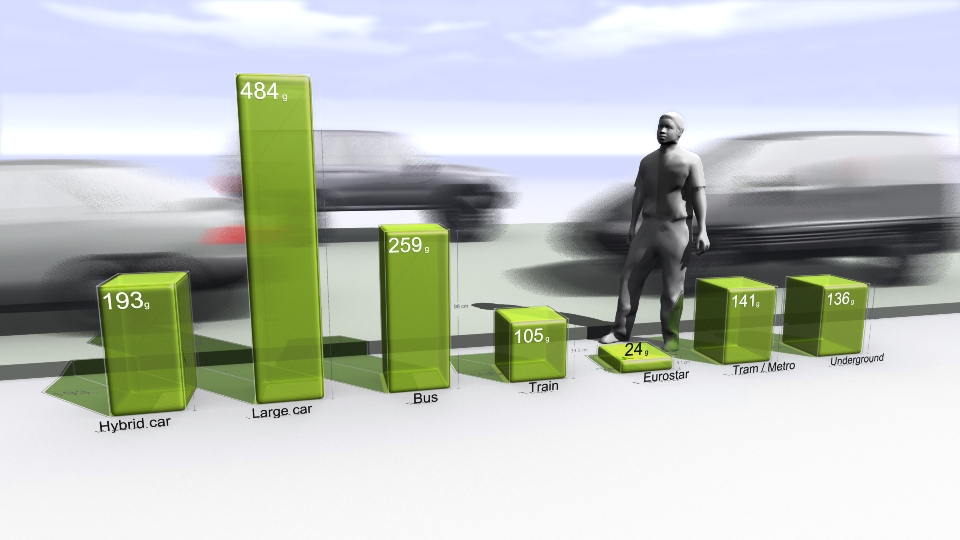
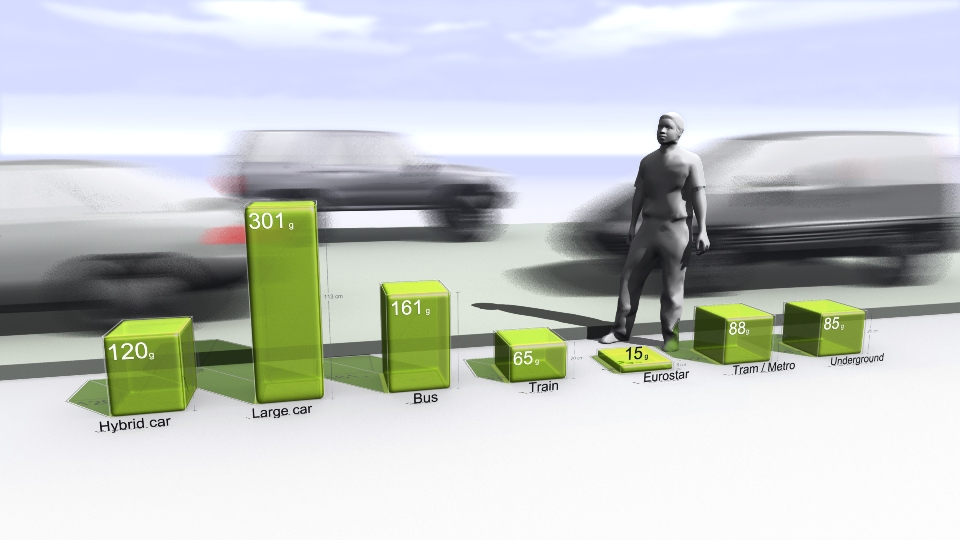
We also provided a number of bespoke images to highlight transport emissions in the UK, emissions of different transport types as well as transport emissions per capita for different countries.
Our Creative Director, Dr Adam Nieman also provided an overview of the importance of carbon visualisation
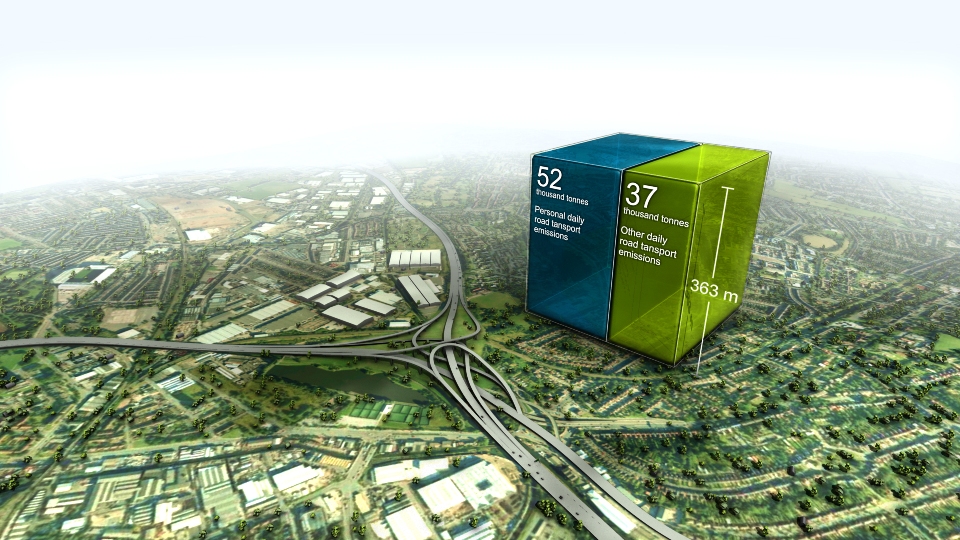
The first visual image uses Spaghetti Junction on the M6 near Birmingham as this basic ground. The familiar image from the British road network makes the immediate point that this is about roads, but then uses the recognisable scale to locate a cube-like shape showing the volume of carbon our cars, lorries and buses put into the atmosphere every day.
The cube presents this visually, while the simple captions fill in the specific details. This, the image is saying, is what 90,000 tonnes of carbon dioxide look like, and that’s what we’re pumping into the atmosphere every day. Suddenly the daily figure is something real and dramatic.
The BP Target Neutral Methodology PDF outlines the data, calculations and assumptions in the image set.