We are keen to find existing carbon emission data sets that would benefit from the Carbon Visuals treatment. So when CEO Antony Turner was invited to participate in an “Energy Data Jam” at Google's New York offices in July 2012 he was quick to accept as the aim of the event was to “…brainstorm how publicly available US datasets might be put to use in the continuing transition to a clean energy future.”
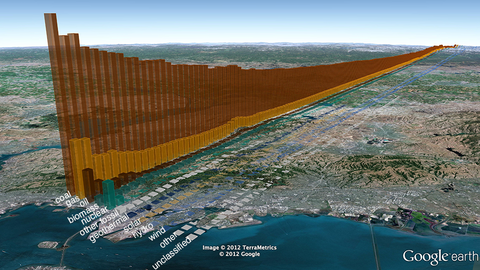
One set that we thought would benefit from ‘becoming visible’ was the eGRID data collated by the US EPA. This gives annual generation and environmental characteristics of all large electric power generators in the US.
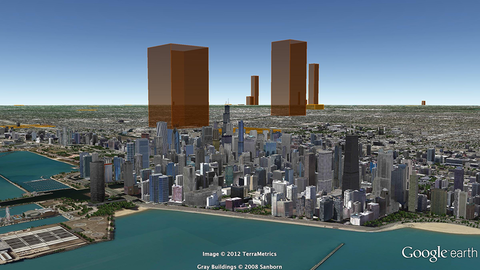
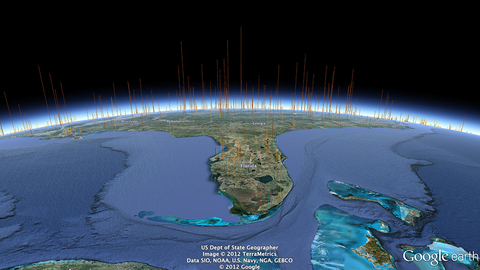
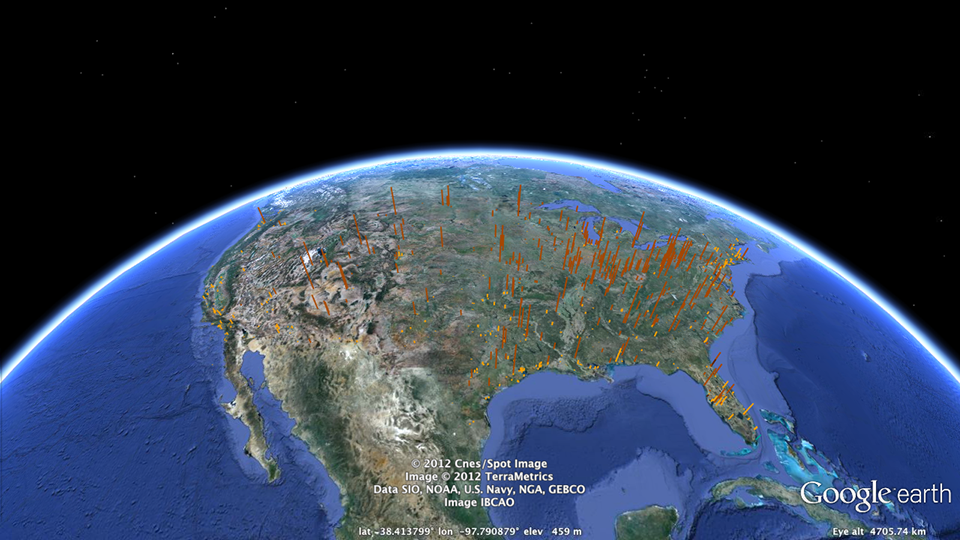
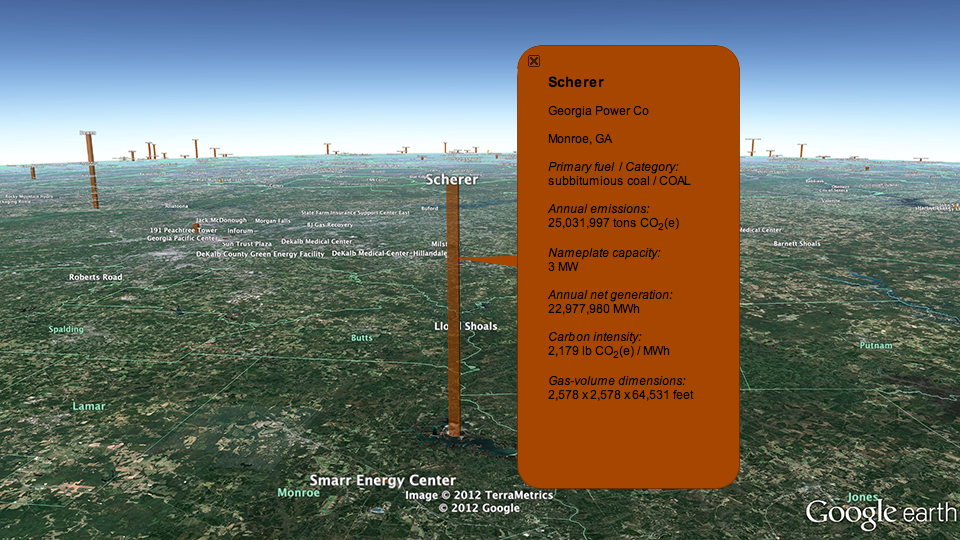
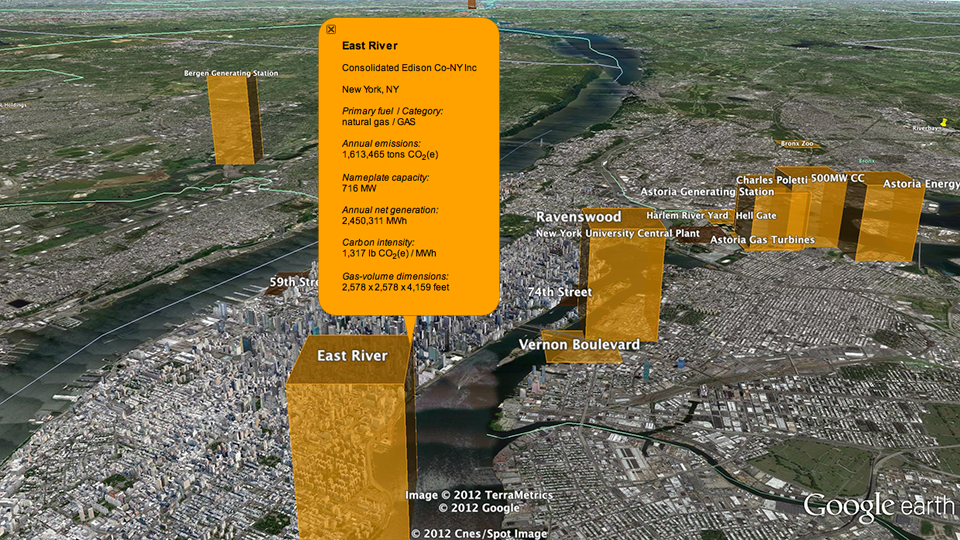
By using our Google Earth Visualiser tool we are able to create images for any location in the US that show nearby power stations and associated data.
If you would like to explore this data using Google Earth you can download the KMZ file here.
Showing the emissions of power stations in this way is experimental, and a first step. We would welcome ideas and proposals on how this could be developed.
If you have collaboration or funding ideas please contact Carbon Visuals CEO Antony Turner.