CLIENT
Project supported by Environmental Defense Fund
PURPOSE
Visual aids for promoting action on the emissions from municipal buildings in New York City.
DESCRIPTION
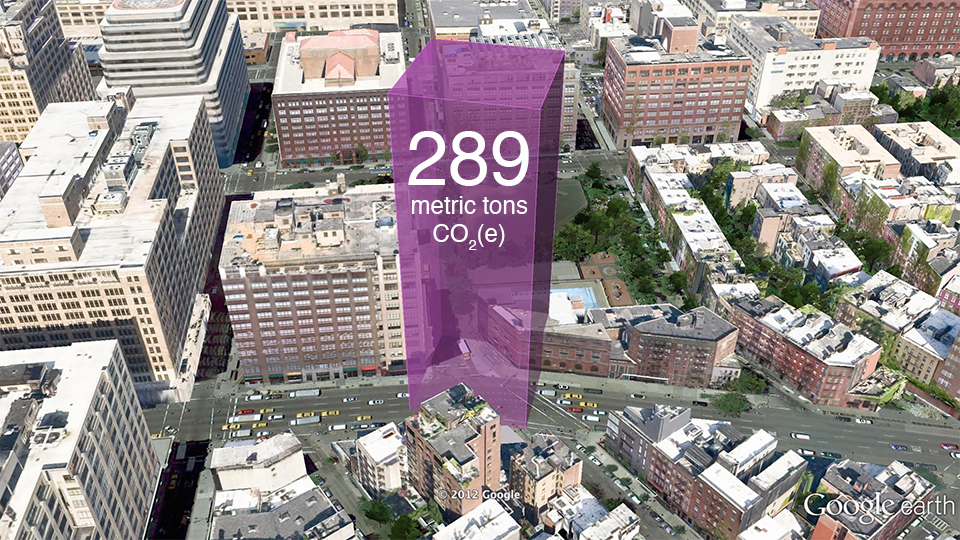
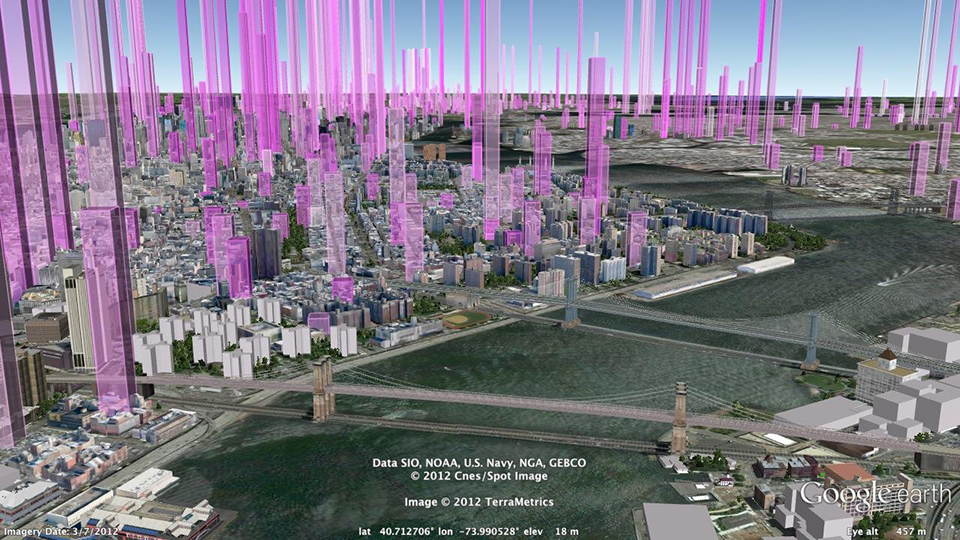
Animation, image set and Google Earth tool that transform data about the emissions of municipal buildings in New York City into a 3D map of the actual volume of carbon dioxide added to the atmosphere.
Seventy five percent of New York City's greenhouse gas emissions come from the energy used by buildings. Reducing this energy is a goal of both building managers and the City of New York.
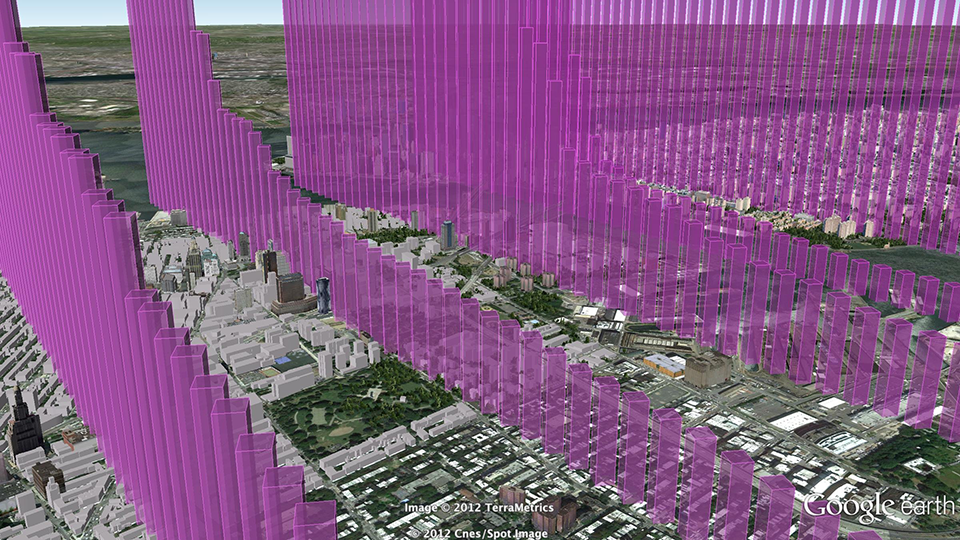
This visualisation takes data about the carbon emissions of municipal buildings in New York City and transforms it into a 3D map of the actual volume of carbon dioxide added to the atmosphere. The city and its buildings are an essential component of the data visualisation.
The New York City animation and this visualisation together provide a wider context for actions on building emissions. These visuals were funded by US-based Environmental Defense Fund.
A longer and more detailed video is available here:www.youtube.com/watch?v=Qmc0UWwiUFA
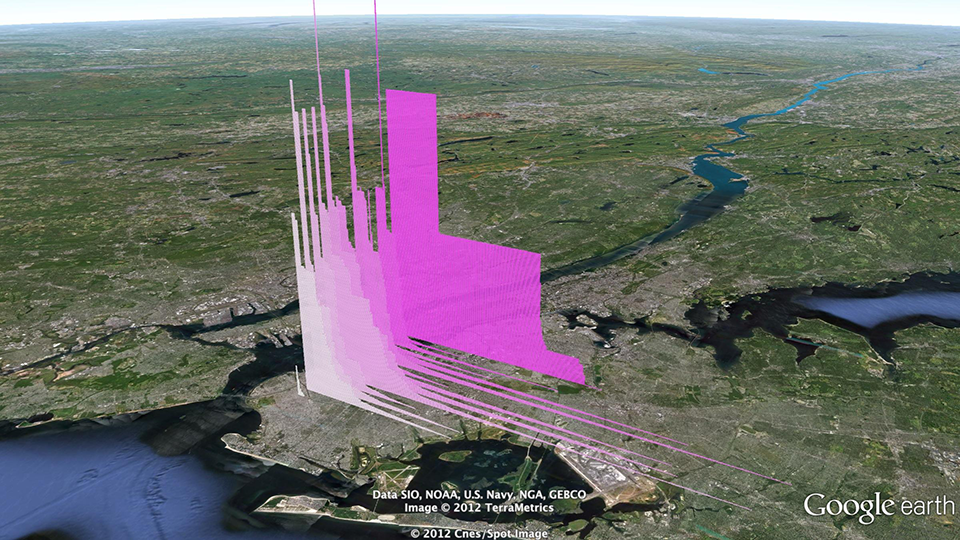
This form of visualisation also lends itself to a form of data analysis that maintains a physical sense of scale. In this view the distribution of emissions is evident for buildings of different ages. If there were an age-based trend this may give the first view of it. The visualisation does show problems with some records that would not be easy to spot in the table (the block of volumes at the back).
Data: http://bit.ly/NYC-BenchmarkingResults
To explore this data-set in Google Earth download the kmz file