The title of this blog post was changed at the request of JWT in March 2015. Carbon Visuals also complied with a request to remove copies of the posters and a photograph of the Forth Bridge poster in situ in a London Underground Station.
Original blog post follows:
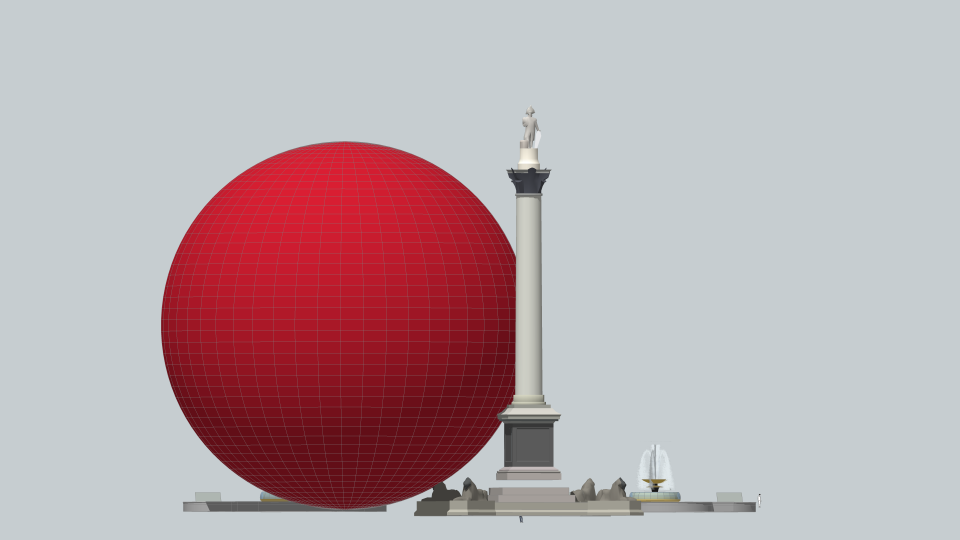
Shell and their creative agency JWT asked Carbon Visuals to provide dimensional reference sketches and methodology checking for the company’s visual campaign on Carbon Capture & Storage (CCS).
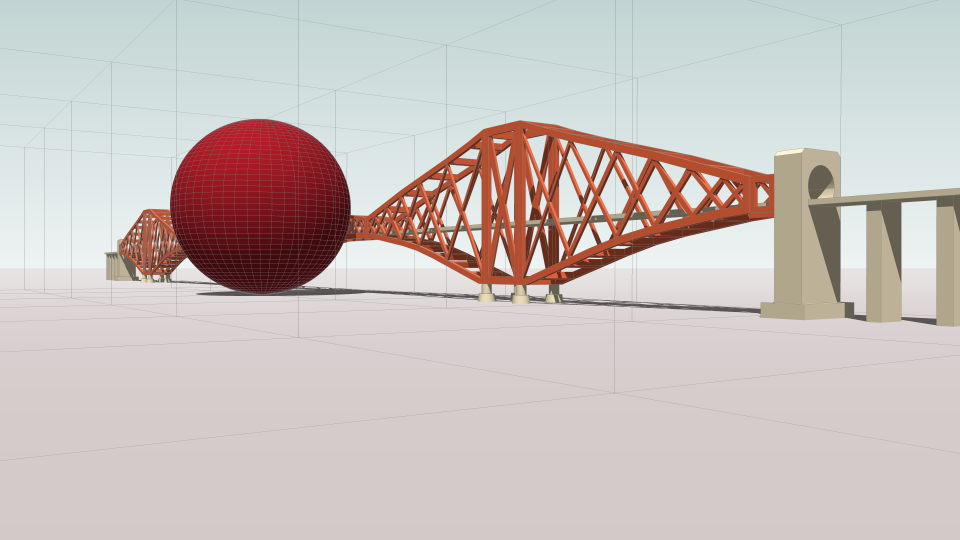
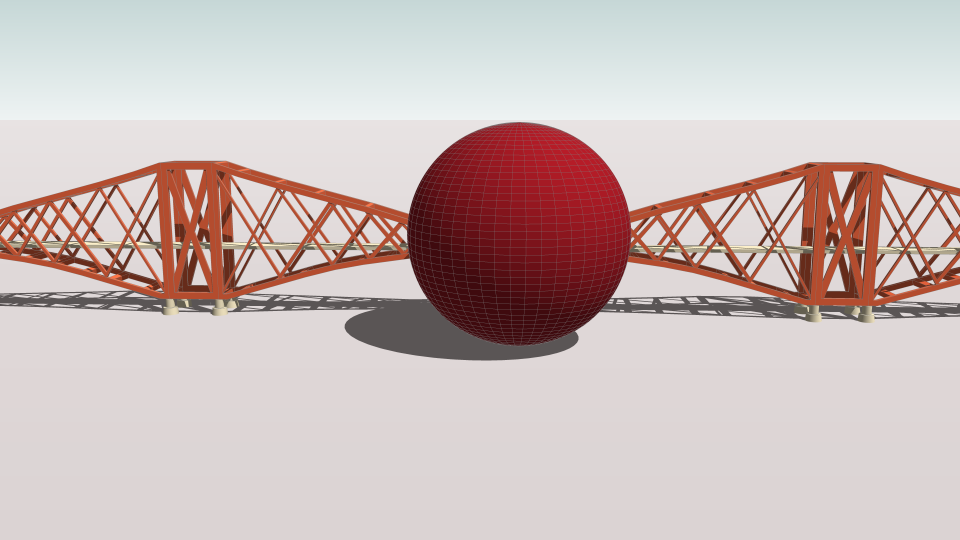
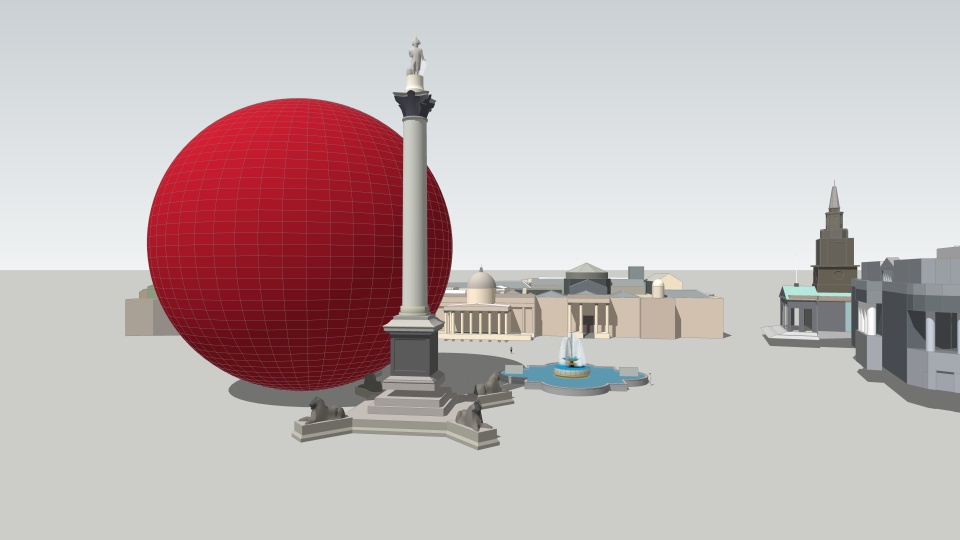
The campaign, run by Shell with images by JWT, highlights the amount of CO2 - one million tonnes per year - that could be captured from the Peterhead Power Station and transported by pipeline offshore for long-term storage deep under the North Sea. More on the project here.
Methodology and dimensional checking of this kind is a service that Carbon Visuals can provide any company or organisation who wants to produce their own, scientifically accurate 3D graphics around emissions, fossil fuels, resource impact or water use.
Our graphics simply say: 'this is how it is’. Whether it is big or small, dangerous or benign is a different question.
Dr Adam Nieman, Creative Director Carbon Visuals
It was concern about climate change that led us to start Carbon Visuals. However, the visualisation techniques we pioneered are neutral; they can be applied by all parties to the debate over how best to meet the challenges of the future. Accurate graphical representations of data can improve the level of debate whoever employs them.
There are many stories that demonstrate our environmental challenges and many examples of where innovation and commitment might help meet these. Carbon Visuals works with corporates, campaigning groups, government departments, universities.
Our aim is to communicate data in ways that are intuitive, accurate and prompt understanding and insights. Whatever is being claimed, graphics like ours act as a reality check - supporting good arguments, challenging disingenuous arguments.
We are happy for any organisations to use graphical techniques we have developed to make their case. As long as they do not use them disingenuously, we will help them do it
We expect it won’t be one technology, political approach or visionary that will solve climate change. So if you have a policy, plan, innovation, campaign, data that you want to visualise then please get in touch.
Be part of telling the story and finding solutions.
CALCULATIONS
Density of carbon dioxide gas at 15 ºC and standard pressure: 1.87 kg/m3.
One million tonnes of carbon dioxide gas is equivalent to:
2,738 tonnes per day - a volume of 1,464,123 cubic metres
114 tonnes per hour - a volume of 61,005 cubic metres